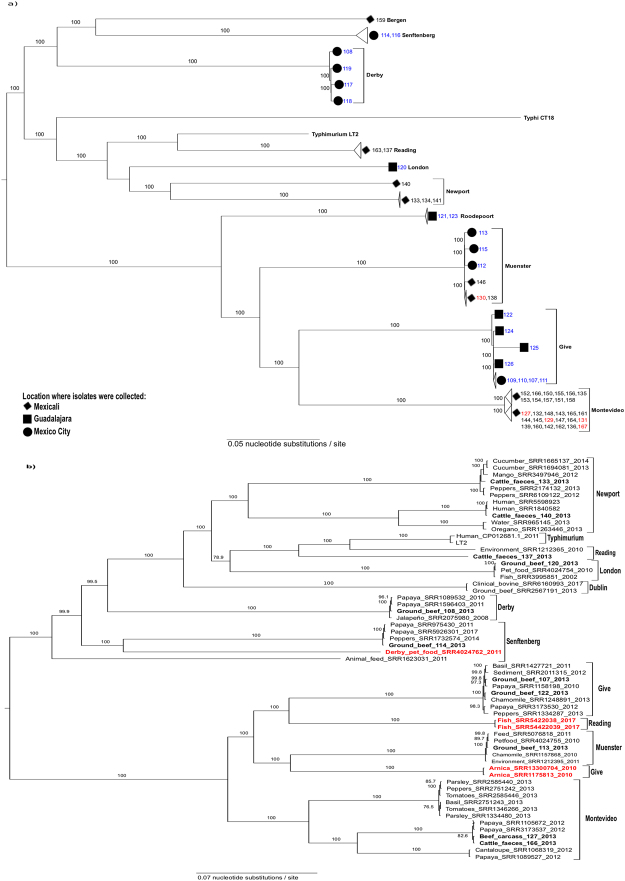
Figure 2.
Maximum likelihood (ML) midpoint-rooted tree based on SNP analysis of: (a) 59 newly sequenced NTS strains, Salmonella Typhimurium LT2 and Salmonella Typhi CT18. Serovars are indicated in bold letters. Sample names are colour-coded according to isolation source (blue, ground beef; red, carcasses/cuts; black, faeces). The cities where isolates were collected are mapped onto the tree. The ML tree was generated in RAxML 7.7.163 under the GTR+ Γ model of nucleotide evolution, visualized using FigTree 1.4.3, and edited with Inkscape 0.91. The best tree was estimated by RAxML rapid bootstrapping (100 iterations) and subsequent ML search. Clade support is indicated above or next to each branch as bootstrap values, except when <70%. (b) 11 representative strains from this study, 47 additional isolates from produce, pet food, seafood, the environment, and clinical cases within Mexico, and 2 isolates of Salmonella enterica ser. Dublin. Isolation sources, NCBI accessions and/or sample names, and collection dates of isolates (if reported) are shown at tip labels. Isolates from this study are highlighted with bold letters. Serovars are mapped onto the tree. Isolates clustering with those of a different serovar are highlighted in red. Salmonella Typhimurium LT2 was used as a reference. The ML tree generation procedure and statistical support are the same as indicated in a.

