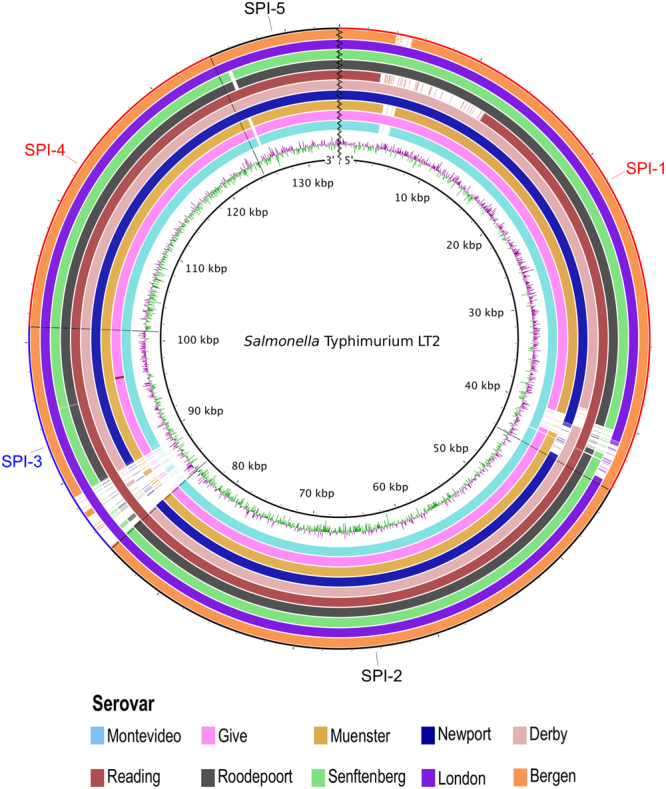
Figure 4.

Analysis of Salmonella SPIs 1 to 5. The inner black circle corresponds to the reference strain Typhimurium LT2, followed by GC skew [(G − C)/(G + C)]. Regions of GC content above average are drawn in green, whereas regions below average are in purple. The remaining slots represents (from inner to outer rings) serovars Montevideo (n = 29), Give (n = 8), Muenster (n = 6), Newport (n = 4), Derby (n = 4), Reading, Roodepoort and Senftenberg (n = 2 each), London and Bergen (n = 1 each). Within each slot, the higher the colour intensity, the higher the nucleotide similarity to the reference strain.
