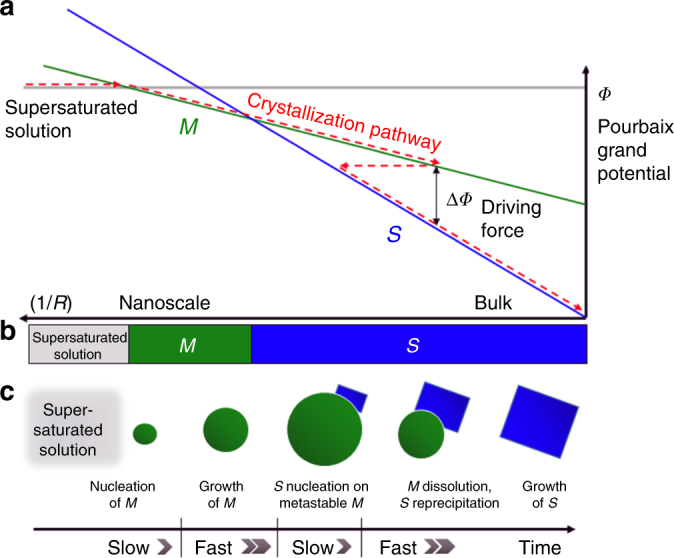
Fig. 1.

Schematic representation of remnant metastability in a crystallization pathway. a Free-energy of three phases (supersaturated solution (gray), M (green), S (blue)) as a function of the surface-area-to-volume ratio, 1/R (R is a particle radius). The gray line corresponds to the free-energy of a supersaturated solution, green is a metastable phase M that is size-stabilized by a low surface energy (given by the slope), and blue is the bulk equilibrium phase S, with high surface energy. b Phase diagram in the 1/R axis created from the projection of lowest free-energy phases. c A multistage crystallization pathway (red arrow in a) proceeds downhill in energy, but phase transformations are limited by nucleation. Crystal growth of M prior to the induction of S means M can grow into a size-regime where phase M is metastable. S will then nucleate, and quickly grow by consuming M via dissolution-reprecipitation. The characteristic length scale of size-driven phase transitions lies in the 2 nm–50 nm range
