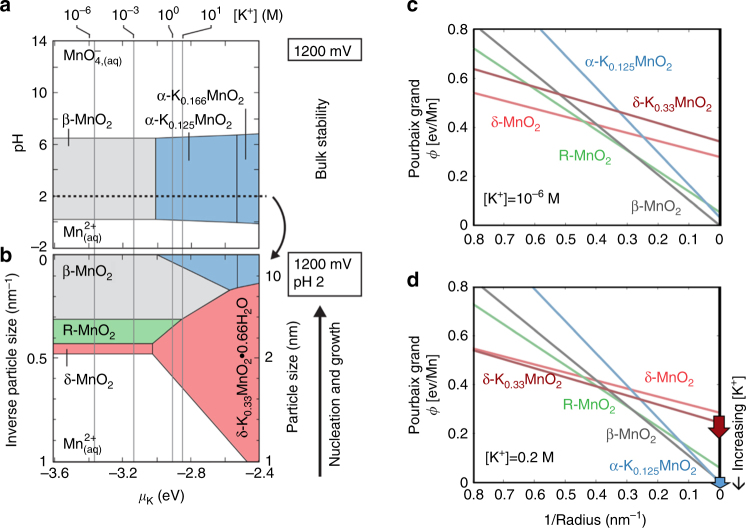
Fig. 2.
Phase diagrams of K-Mn oxide systems at E = 1.2 V. a pH-μK slice at 1/R = 0 indicating bulk stabilized phases. b 1/R-μK slice at pH = 2 illustrating the size-stabilized phases. c, d Pourbaix grand free-energies versus 1/R, showing the metastable energy landscape of crystal growth where [K+] = 10−6 M (c) and [K+] = 0.2 M (d). d is representative of pathways at both [K+] = 0.2 M and [K+] = 0.33 M due to their similar [K+]. The three reaction conditions are referred to as PK = 0, PK = 0.2, and PK = 0.33, respectively, based on their [K+]. , which means that the driving force for the transformation from the δ to the α phase decreases at a larger [K+]. The red and blue arrows indicate the trend that the slope of and changes with increasing [K+]

