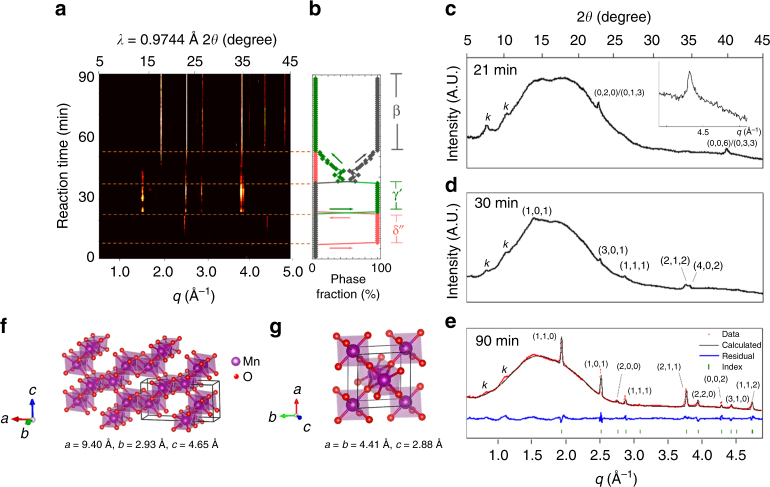
Fig. 3.
In situ X-ray scattering analysis of PK = 0. a The evolution of X-ray scattering profiles with time along PK = 0. q is related to the diffraction angle (θ) and incident wavelength (λ) by and λ = 0.9744 Å. b Phase fraction evolution calculated from the intensities of diffraction peaks in a. c–e X-ray scattering profiles of the δ′′ (c), γ′ (d), and β (e) phases, respectively. The inset figure in c shows the asymmetrical tail of the peak at q = 4.45 Å−1. The weak peaks around q = 0.9 and 1.2 are caused by a kapton film covering the capillary reactor (marked by k in c–e). The broad peak around q = 1.5–2.5 Å−1 is caused by imperfect background subtraction (see Supplementary Notes 3 for details). f Structure of a pristine R phase. The γ′ phase discussed in this paper is an R phase with a random amount of β (1 × 1 tunnel) intergrowth. g Refined structure of the β phase (see Supplementary Notes 5 for refinement details)

