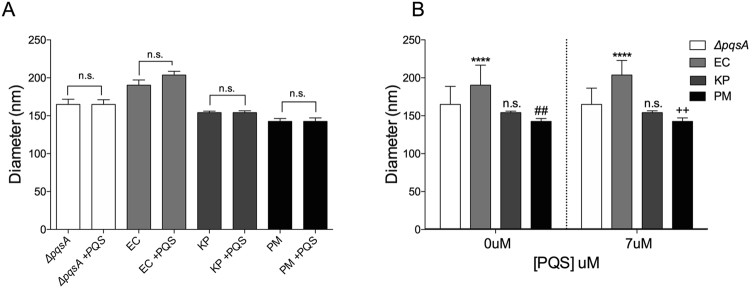
Figure 3.
Comparison of the mode diameter of OMVs induced by PQS in each species. (A) Differences in OMV size +/− PQS within each species. No statistically significant difference was observed for any species. (B) Size comparisons organized to highlight differences between species both in the absence and presence of PQS. Asterisks represent statistically significant differences in mode OMV diameter compared to ΔpqsA under the same condition. Exogenous [PQS] in “+PQS” = 6.7 ± 1.4 µM. Size was measured by NTA and statistical significance was assessed by one-tailed Student t-test. (n.s. = p > 0.05, **p = 0.0079, ##p = 0.0047, ++p = 0.0039, ****p < 0.0001, n = 12, E. coli n = 15).

