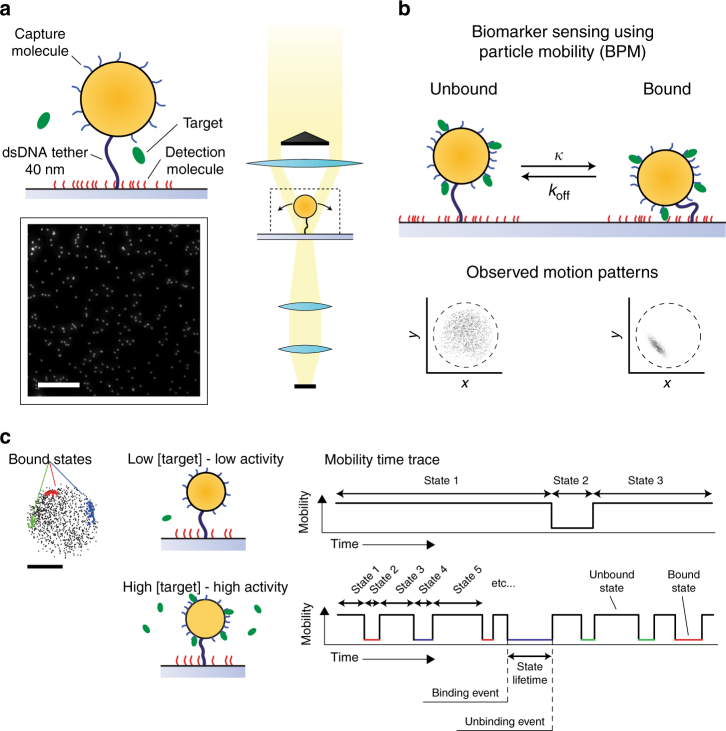
Fig. 1.
Biomarker monitoring based on the sensing of particle mobility (BPM). a Particles (orange) are tethered to the substrate via a 40 nm dsDNA strand (black). The particles are functionalized with capture molecules (blue), which serve to capture the target molecules from solution. The substrate is functionalized with lower-affinity detection molecules (red), which create short-lived target-induced bonds between the particle and the substrate. Target molecules (green) are either 22-nucleotide ssDNA molecules or thrombin proteins. In the experiments, the high-affinity capture molecules were biotinylated and coupled to the particles by biotin–streptavidin coupling; the low-affinity detection molecules were provided with a biotin tag and coupled to the substrate by neutravidin or streptavidin (see Methods). The particles are detected using darkfield microscopy, imaging the particles as bright dots on a dark background. The scale bar represents 50 µm. b Target binding causes the particle to become intermittently bound to the substrate resulting in switching between different mobilities and motion patterns. The effective association rate of the particle to the substrate is indicated as κ30, the dissociation rate is given by koff. c The mobility of the particles is analyzed as a function of time and the binding/unbinding events are digitally detected for hundreds of particles in parallel. The time between two consecutive events corresponds to the lifetime of the enclosed state. Two example mobility traces are sketched for a particle with no target molecules in solution or with a high target molecule concentration, leading to a low or a high observed switching activity. The scale bar represents 250 nm

