Fig. 2.
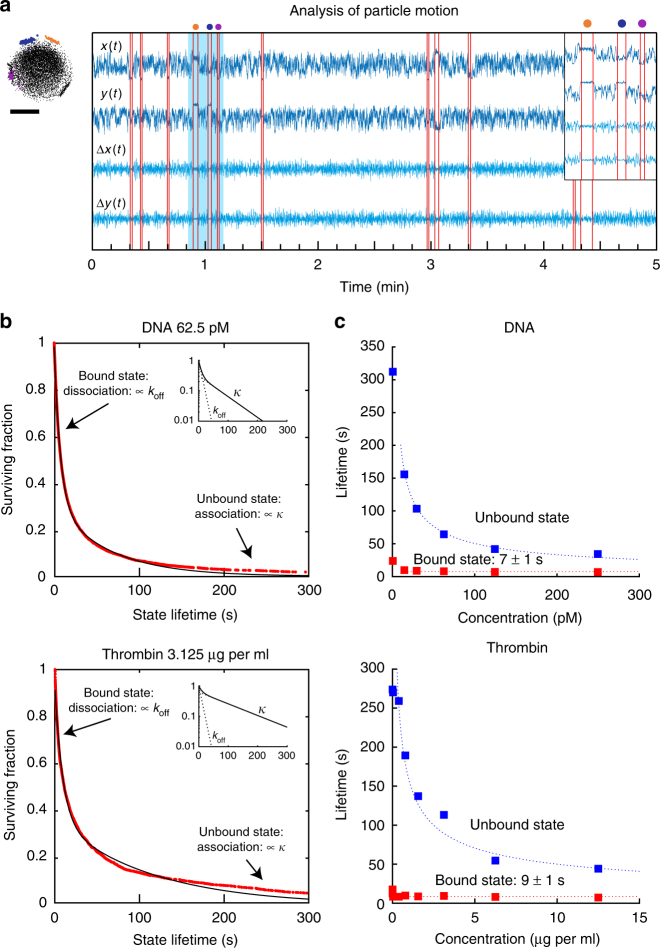
Analysis of mobility time-traces in terms of state lifetimes. a The mobility of a single particle with switching activity. The optically recorded in-plane position (x, y) and the step size (Δx, Δy) are shown as a function of time. The detected times at which the motion is observed to change are indicated with vertical red lines. The timespan between two consecutive change events corresponds to a single-state lifetime of the particle. The motion pattern is shown of the particle that was analyzed. An expanded view of time traces with three bound states is shown in the inset, corresponding to the timespan marked by the light blue area in the main graph. The confined motion patterns of three bound states are indicated with colored data points. In the time trace three corresponding bound states are indicated with dots above the graph. The scale bar represents 250 nm. b State lifetime analysis for ssDNA and thrombin experiments, graphed as survival curves. States with a lifetime of 1 s or more have been analyzed. The lifetimes were determined from the analysis of the motion data during a 5-min measurement at a target concentration of 62.5 pM DNA (501 tracked particles) or 3.125 μg/mL thrombin (407 tracked particles), combining both unbound states and bound states in a single survival curve. Red curves represent data, black lines represent fits. The insets show the fit curves and the individual contributions of the time constants koff and κ; the lin-log scale highlights the double-exponential character of the decay. For DNA: and ; for thrombin: and . c Dependence of lifetimes of the bound (red) and unbound (blue) states on the target concentration. The error related to the stochastics of the measurement is smaller than the symbol size; experimental contributions to the measurement errors are discussed in Supplementary Note 1. The dotted lines indicate the approximate trend of the characteristic lifetimes. The dotted blue lines scale with the target concentration as for DNA and thrombin. The dotted red lines do not depend on the concentration (see also Supplementary Notes 2 and 3)

