Fig. 4.
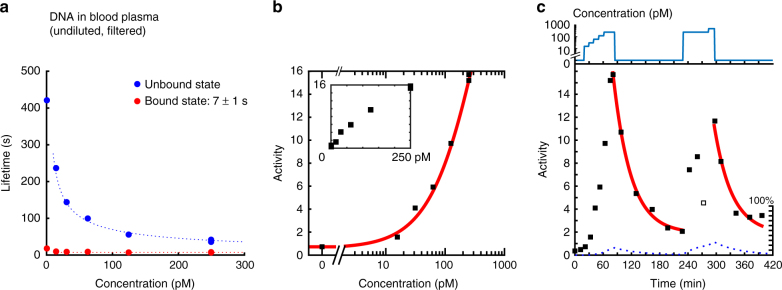
Monitoring of ssDNA in undiluted filtered blood plasma. a Lifetimes of the bound and unbound states as a function of the target concentration. The dotted blue line scales with the target concentration as . The dotted red line does not depend on the concentration. b Activity as a function of concentration, recorded during the stepwise increase in concentration. The fit does not yield a reliable Kd value due to the absence of saturation in the curve. The inset shows the dose–response curve on double-linear axes. c Sensor reversibility is demonstrated by recording the particle activity as a function of time. The graph shows the target molecule concentration, as well as the measured particle activity as a function of time. In the first section (up to 80 min) the target molecule concentration was increased in a stepwise fashion. Thereafter the concentration was kept at zero for 150 min and subsequently pulsed from zero to a high concentration and brought back to zero again. The data point with open square is considered to be an outlier, as it deviates from measurements before and after. Fits (red solid lines) represent exponential decay curves of the activity using Eq. (6), with a time-constant and background Ab that is the same for both fits in the measurement series. A time constant min was found in blood plasma. The dotted curves illustrate the activity (on a scale from 0 to 100%) predicted by the reaction kinetics model (see Supplementary Note 4)

