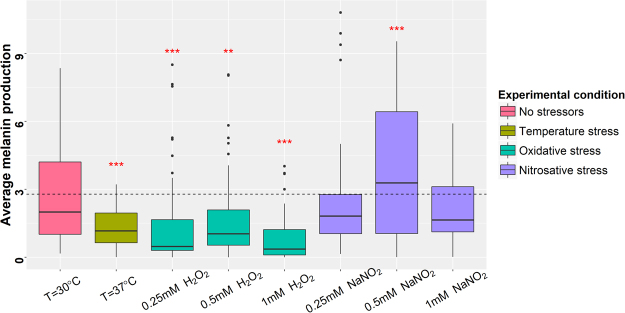
Figure 2.
Average melanin production of the C. neoformans var. neoformans population in different environments. The melanin levels of the C. neoformans var. neoformans population was quantified: from left, in 30 °C, 37 °C, low oxidative stress (0.25 mM H2O2), intermediate oxidative stress (0.5 mM H2O2), high oxidative stress (1 mM H2O2), low nitrosative stress (0.25 mM NaNO2), intermediate nitrosative stress (0.5 mM NaNO2) and high nitrosative stress (1 mM NaNO2). The dashed line represents the average melanin production of the population in the negative control (no added stressors). The red stars above the boxplots represent the degree of statistical significance to which the average melanin production differs from that of the negative control.

