Fig. 2.
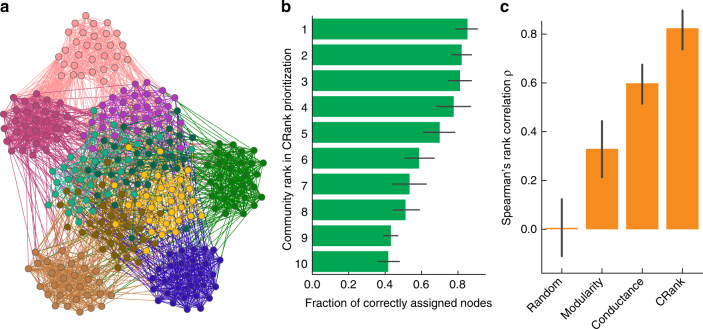
Synthetic networks with planted community structure. a–c In networks with known modular structure we can evaluate community prioritization by quantifying the correspondence between detected communities and the planted communities. a Benchmark networks on N = 300 nodes are created using a stochastic block model with 10 planted communities10. Each planted community has 30 nodes, which are colored by their planted community assignment. Planted communities use different values for within-community edge probability pin, five use pin = 0.6 and five use pin = 0.2. As a result, planted communities with smaller within-community probability pin are harder to detect. For each benchmark network we apply a community detection method6 to detect communities and then use CRank to prioritize them. CRank produces a ranked list of detected communities. The gold standard rank of each community is determined by how accurately it corresponds to its planted counterpart. b Each bar represents one detected community and the bars are ordered by CRank’s ranking with the highest-ranked community located at the top and the lowest ranked community located at the bottom. As a form of validation, the width of each bar corresponds to the fraction of nodes in a community that are correctly classified into a corresponding planted community, with error bars showing the 95% confidence intervals over 500 benchmark networks. A perfect prioritization ranks the bars by decreasing width. Notice that CRank perfectly prioritizes the communities even though it only uses information about the network structure, and has no access to information about the planted communities. c Prioritization performance is measured using Spearman’s rank correlation ρ between the generated ranking and the gold standard ranking of communities. A larger value of ρ indicates a better performance. Across all benchmark networks, CRank achieved average Spearman’s rank correlation of ρ = 0.82. Alternative approaches resulted in poorer average performance: ranking based on modularity and conductance achieved ρ = 0.33 and ρ = 0.60, respectively, whereas random prioritization obtained ρ = 0.00

