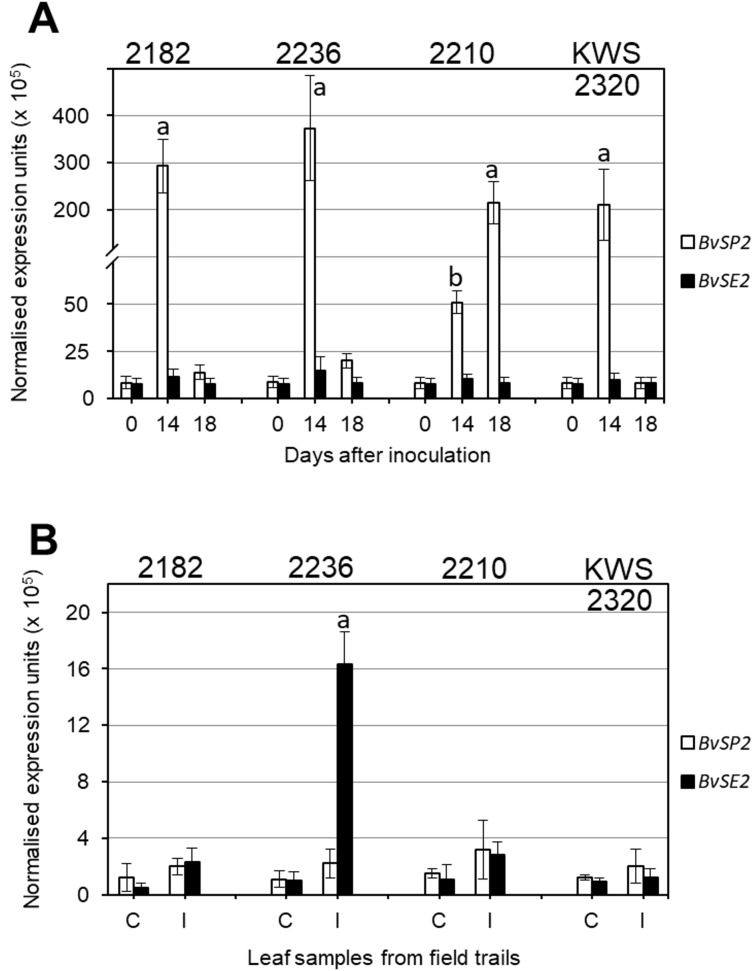
Figure 3. Quantitative expression analyses (qPCR) of BvSP2 and BvSE2 genes (clear and black bars, respectively) in leaves of sugar beet plants.
(A) Plants at the 3–4 leaf stage were inoculated by Fusarium oxysporum Sch., isolate No. 5, and indicated Day 0, as Controls, for comparison with Days 14 and 18 since inoculations. (B) Mature plants from non-infected Controls (C), and Infected (I) parts of field trails. Names of the four selected sugar beet lines are shown on the top of each figure panel. Expression data were normalised using the reference gene, Glutamine synthetase (LOC104883503). Bars show the average for two biological and two technical replicates in each measurement ± Standard Error. Different letters indicate significant differences with other samples at the same time-points and Controls (P < 0.01 for (A) and P < 0.05 for (B)).

