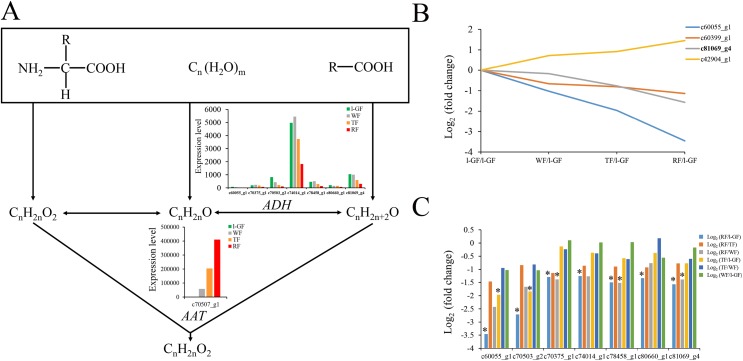
Figure 6. The expression pattern of genes involved in ester biosynthesis.
(A) Ester biosynthesis pathway. Enzyme names, unigene ids and expression patterns are indicated on each step. The y-axis represents average read_count value of each library. ADH, alcohol dehydrogenase; AAT, alcohol acyltransferase. (B) The relative expression of down-regulated genes in the degradation of aromatic compound pathway. Black fonts indicate the up-regulated gene ID. (C) The expression pattern of DEGs in the degradation of aromatic compound pathway. The asterisk (*) indicates that the gene is satisfied the differentially expression analysis criteria (padj < 0.05 and log2 (fold change) ≥ 1 or log2 (fold change) ≤ −1) in the corresponding comparative combination.

