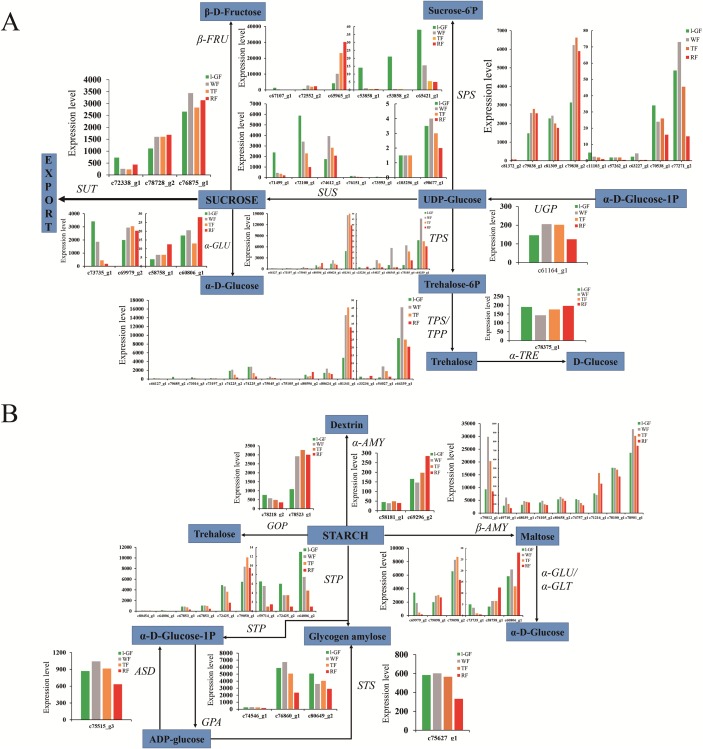
Figure 7. The expression pattern of genes involved in starch and sucrose biosynthesis.
(A) Sucrose biosynthesis pathway. (B) Starch biosynthesis pathway. Enzyme names, unigene ids and expression patterns are indicated on each step. The y-axis represents average read_count value of each library. Study sites: β-FRU, β-fructofuranosidase; α-GLU, α-glucosidase; SUT, sucrose translocase; SUS, sucrose synthase; SPS, sucrose-phosphate synthase; TPS, trehalose 6-phosphate synthase; TPP, trehalose 6-phosphate phosphatase; α-TRE, α-trehalase; UGP, UTP—glucose-1-phosphate uridylyltransferase; ASD, ADP-sugar diphosphatase; STP, starch phosphorylase; GPA, glucose-1-phosphate adenylyltransferase; STS, starch synthase; GOP, glycogen operon protein; α-AMY, α-amylase; β-AMY, β-amylase; α-GLU, α-glucosidase.

