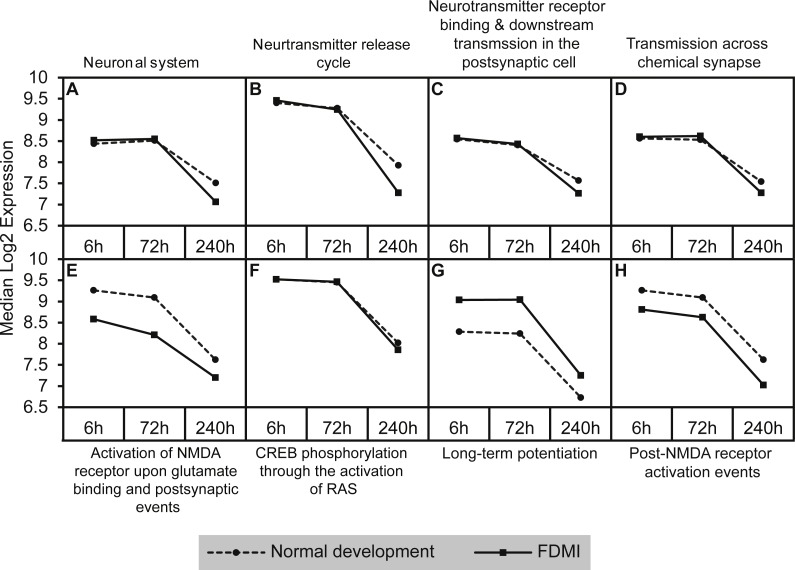
Figure 6. Median expression of pathways involved in neurotransmission during normal ocular development and in FDMI.
Graphs of the neurotransmission-related pathways with significant expression shifts during normal ocular development (dotted lines) and FDMI (solid lines) are shown. (A–D) Four pathways were significant in both normal development and FDMI. The leading-edge subsets for these pathways identified 115 common core genes shared within these pathways during normal development and during FDMI and 27 other core genes specific to normal development and nine specific to FDMI (File S1). (E–H) Graphs indicate FDMI induced down regulation of expression shift in four additional neurotransmission-related pathways with significant expression shifts during FDMI (solid lines) only. These pathways were not significant during normal ocular development but data are shown for comparison purposes (dotted lines). (A) Neuronal system (B) Neurotransmitter release cycle (C) Neurotransmitter receptor binding & downstream transmission in the postsynaptic cell (D) Transmission across chemical synapse (E) Activation of NMDA receptor upon glutamate binding and postsynaptic events (F) CREB phosphorylation through the activation of RAS (G) Long-term potentiation (H) Post-NMDA receptor activation events.

