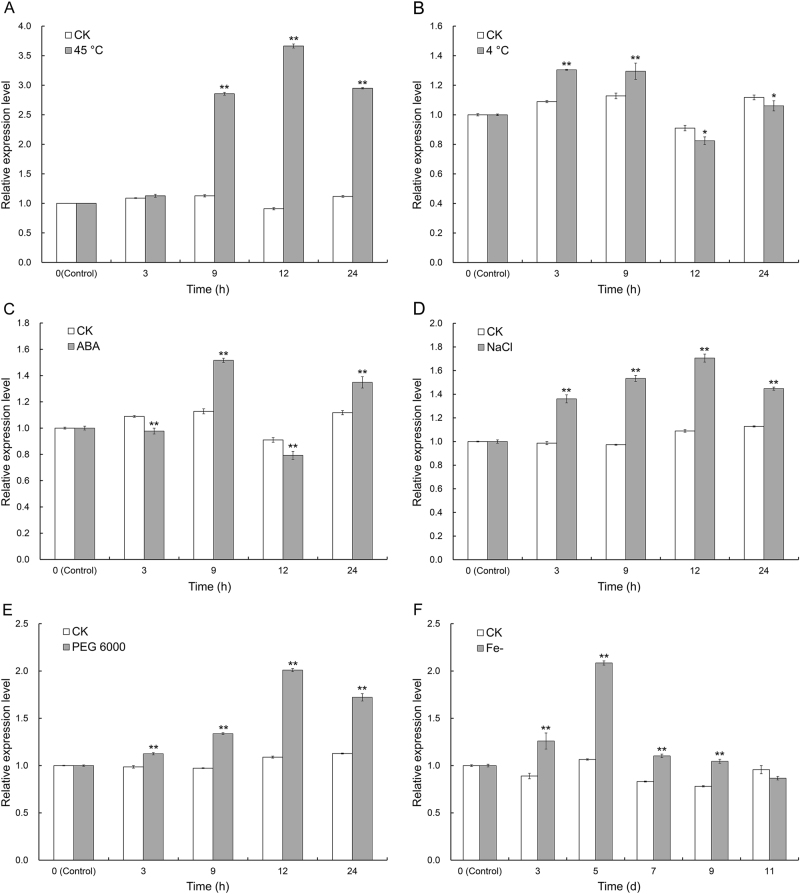
Fig. 3. Transcription profiling of CmCPL1 in plants exposed to abiotic stress.
a Heat stress (40 °C), b low-temperature stress (4 °C), c treatment with 100 μM ABA, d salinity stress (200 mM NaCl), e drought stress (20% PEG 6000), f iron deficiency. Each value represents the mean of three biological replicates, and the whiskers indicate the SE. *, **: Treatment means differed from the control means (CK) at, respectively, P < 0.05 and <0.01

