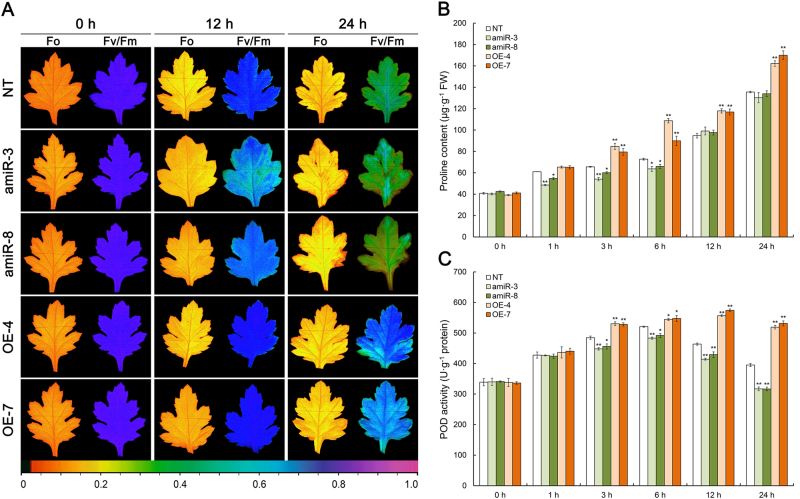
Fig. 6. The effect of heat stress on physiological indicators in the leaves of CmCPL1 transgenic chrysanthemum plants. amiR-3, -8, CmCPL1 knockdown plants; OE-4, -7, CmCPL1 over-expression plants; NT, non-transgenic plants.
a Fv/Fm and Fo images at the end of the stress episode. The pseudocolored bar depicted at the bottom of the panel ranges from 0 (black) to 1.0 (purple). b The leaf content of free proline and c leaf POD activity. Values shown in the form of mean ± SE (n = 3). *, **: Treatment means differed from the control means (NT) at, respectively, P < 0.05 and <0.01

