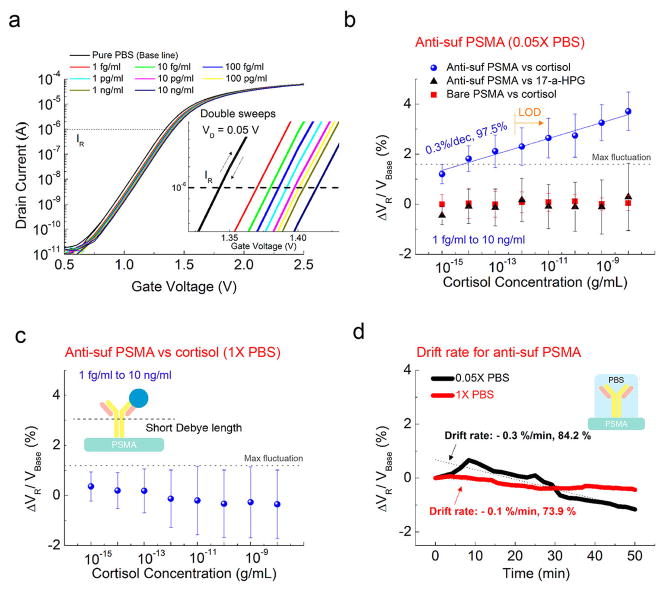
Figure 2.
(a) Representative transfer curves of antisuf PSMA versus cortisol concentration in 0.05× PBS. Inset: Close-up transfer curves. (b) ΔVR response of antisuf PSMA in terms of cortisol and 17-α-HPG concentrations in 0.05× PBS. The ΔVR response of cortisol on bare PSMA is compared. Mean ΔVR increase by 0.3% for every 10-fold increase in the cortisol concentration for five samples. Random signals for cortisol were observed in the bare PSMA for four samples. Also, no sensitivity for 17-α-HPG is obtained by antisuf PSMA for three samples. (c) ΔVR of antisuf PSMA versus different concentrations of cortisol in a 1× PBS solution over three samples. (d) Drift rate of antisuf PSMA measured in 1× and 0.05× PBS by repeating the transfer curve for 50 min after stabilization. In both cases, the drift had a negative slope.

