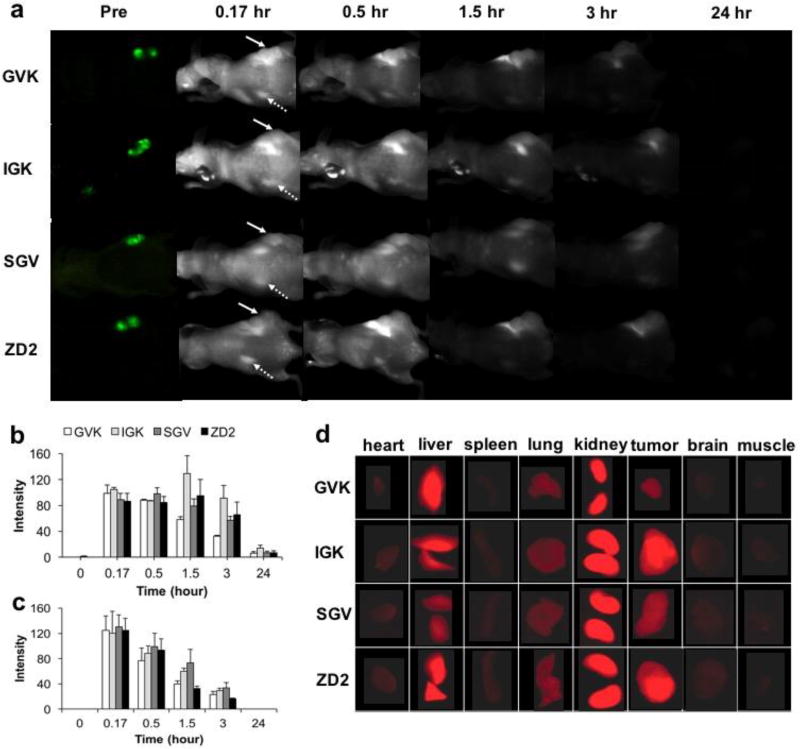
Figure 2.
In vivo fluorescence imaging of PC3-GFP xenograft mice injected with various peptide-Cy5.5 at 10 nmol. Images were taken before and at 0.17, 0.5, 1.5, 3 and 24 hrs after injection (a); in vivo fluorescence intensity of tumors (b) and kidneys (c) under arrows over the period of 24 hrs. Tumor are indicated by full arrows, while kidneys are indicated by dotted arrows; ex vivo fluorescence images of organs at 1.5 hr post injection(d) various peptide-Cy5.5 at 10 nmol. (n = 5).

