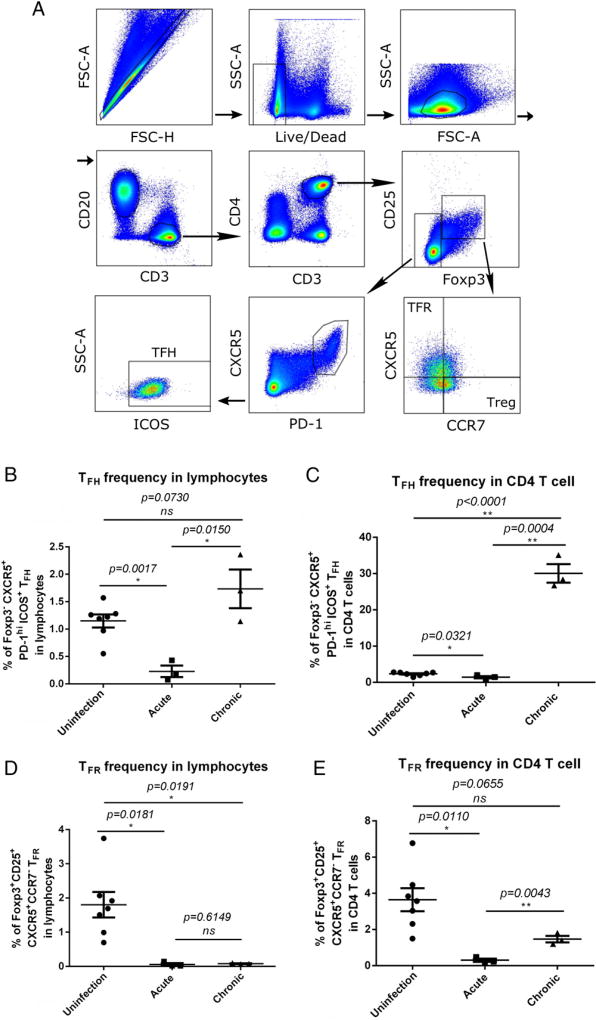
FIGURE 2.
Frequency of TFH and TFR cells in peripheral lymph node tissues following SIV infection. (A) Representative image of flow cytometry gating strategy for TFH and TFR cells. Frequency of TFH (Foxp3− PD−1hi CXCR5+ ICOS+) cells in total lymphocytes (B) and in CD4 T cells (C) following SIV infection. Frequency of TFR (Foxp3+ CD25+ PD-1hi CXCR5+ CCR7−) cells in total lymphocytes (D) and in CD4 T cells (E) following SIV infection. Data are mean ± SEM. *p < 0.05, **p < 0.001, Mann–Whitney nonparametric t test. ns, not significant.

