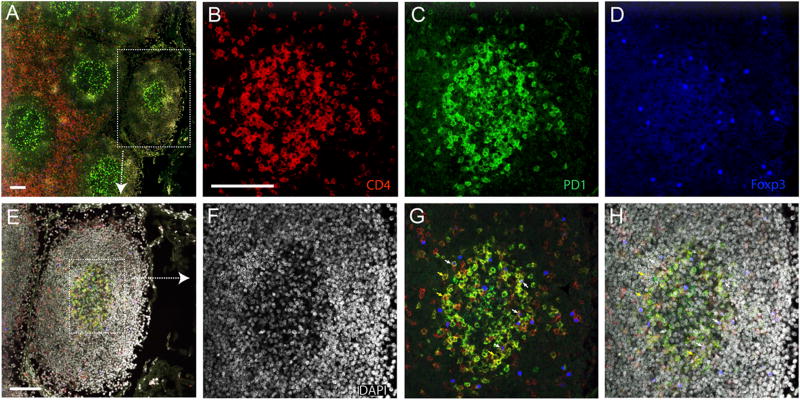
FIGURE 3.
Confocal photomicrographs of TFH and TFR cell localization in lymph node tissues. (A) B cell and T cell zones in LTs of an SIV-naive macaque are characterized by the distinct density of CD4 T cells (red). The box highlights a B cell follicle. Immunofluorescence staining of CD4 [(B), red], PD1 [(C), green], FoxP3 [(D), blue], and nuclei [(F), DAPI] in the GC shown in the box in (E). (G and H) Merged images; white and yellow arrows indicate representative TFH and TFR cells, respectively. Scale bars, 100 µm.

