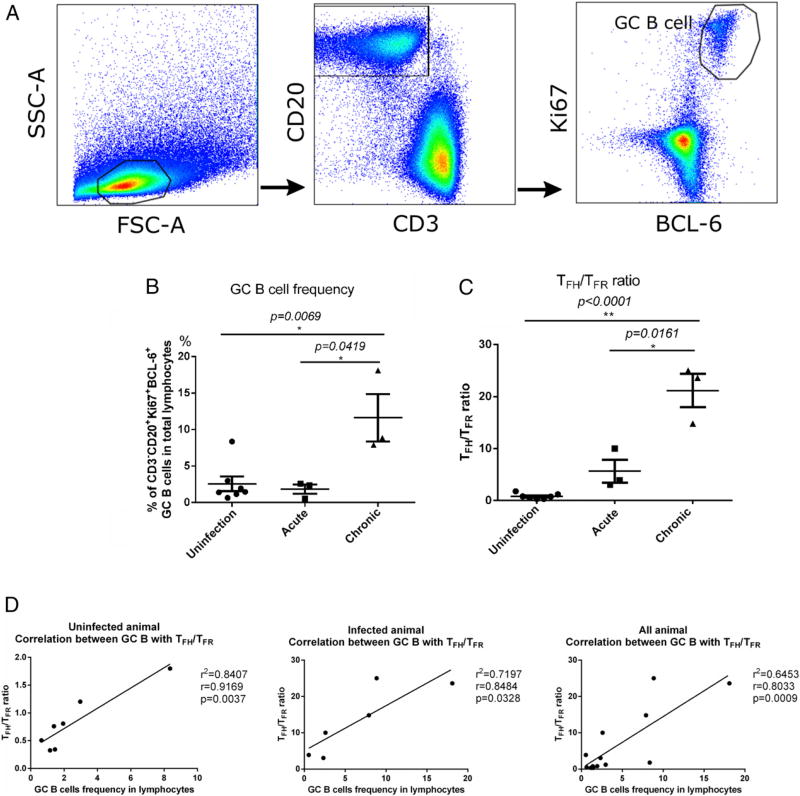
FIGURE 4.
Frequency of GC B cells following SIV infection. (A) Representative image of flow cytometry gating strategy for GC B (CD3− CD20+ Bcl-6+ Ki67+) cells. (B) Frequency of GC B cells. (C) TFH/TFR cell ratio. (D) Correlation between the frequency of GC B cells in LTs and the TFH/TFR cell ratio. Data are mean ± SEM. Pearson r correlation was performed for correlation between the frequency of GC B cells and the TFH/TFR cell ratio. *p < 0.05, **p < 0.001, Mann–Whitney nonparametric t test.

