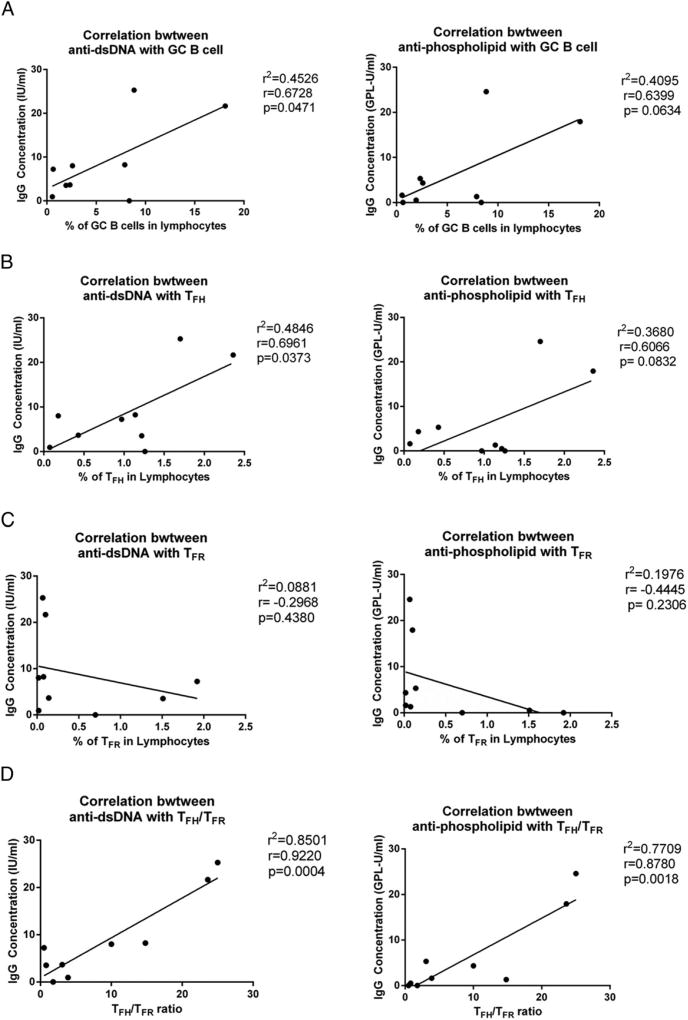
FIGURE 5.
Correlation analyses between autoreactive Abs and the frequency of TFH cells or TFR cells or the TFH/TFR cell ratio. Correlation between the levels of anti-dsDNA and anti-phospholipid autoreactive Abs and the frequency of GC B cells (A), the frequency of TFH cells (B), the frequency of TFR cells (C), and the TFH/TFR cell ratio (D), using Pearson r correlation.

