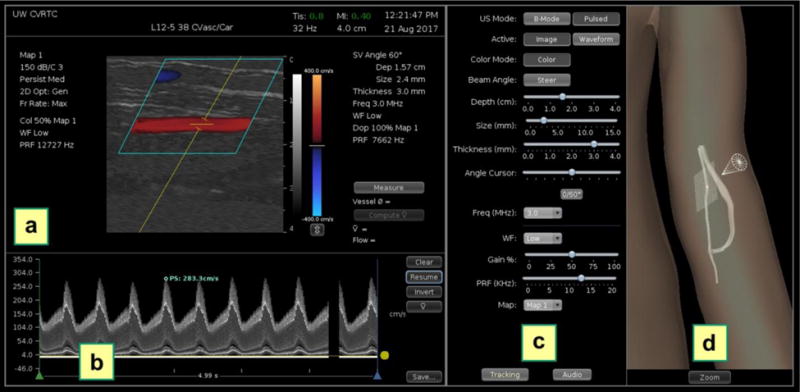
Figure 4.

Duplex ultrasound simulator examiner interface. (a) Color Doppler image showing blood flow velocity superimposed on a B-mode image. (b) Doppler spectral waveform recorded from the Doppler sample volume location shown in (a). A peak systolic velocity measurement has been made by placing a cursor (blue circle) at a selected point on the waveform. (c) System controls for the ultrasound image display and Doppler examination settings (including beam angle, sample volume depth, sample volume size, angle correction cursor and pulse repetition frequency). (d) 3D display showing the location of the vessel model, the transducer (cone) and the 2D image plane on the mannequin. This display is intended for training; it can be disabled for competency testing.
