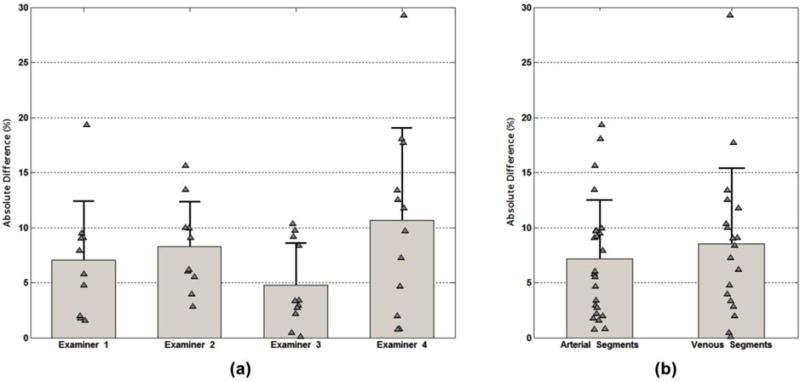
Figure 7.

Comparison of measured versus true peak systolic velocity (PSV) for two dialysis access fistulas examined by four experts. (a) Percent absolute deviation from the true PSV for each of the four examiners. (b) Percent absolute deviation for measurements in the arterial and venous segments. Bar height: mean absolute deviation. Error bar length: standard deviation. Triangles: individual data points.
