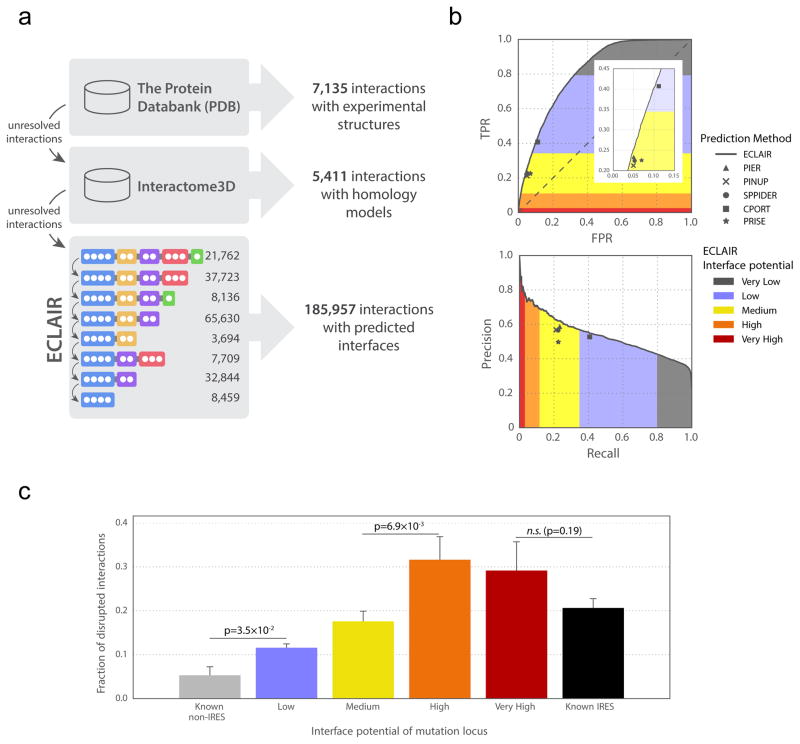
Figure 2.
ECLAIR prediction results. (a) Workflow for classifying interfaces for all interactions in 8 species. Interactions without experimentally determined or homology modeled interfaces are classified by ECLAIR. (b) ROC and precision-recall curves comparing ECLAIR with the indicated interface residue prediction methods. (c) Fraction of interactions disrupted by the introduction of random population variants in known and predicted interfaces. (Significance determined by two-sided Z-test; n.s. denotes not significant)

