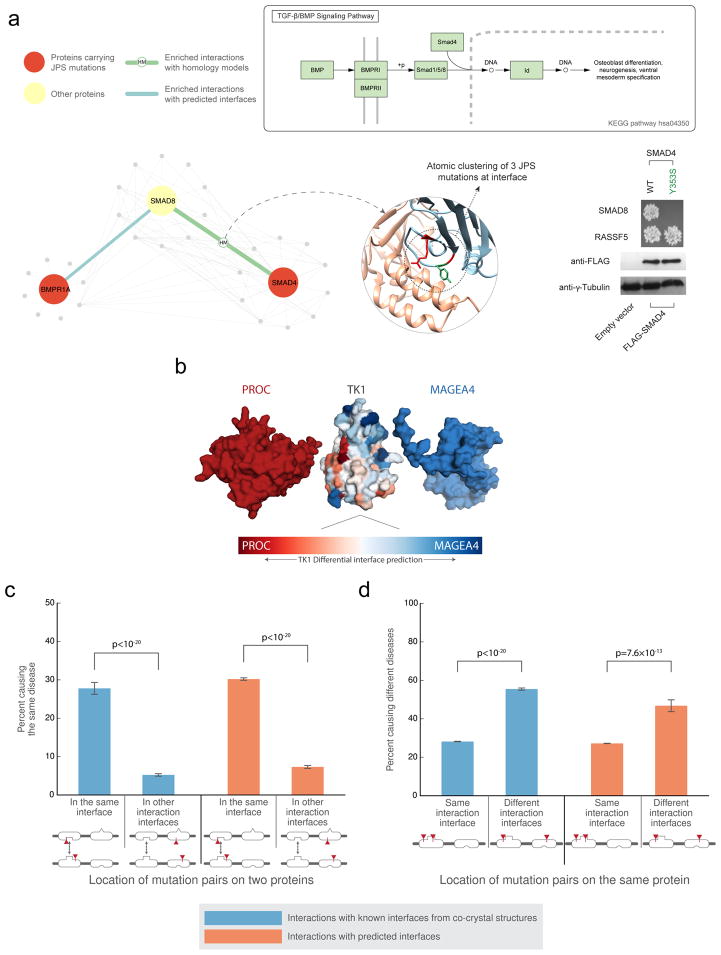
Figure 5.
Interaction partner-specific interface prediction. (a) The top schematic depicts the TGF-β/BMP signaling pathway. The bottom schematic illustrates that atomic clustering reveals a mutation hotspot for juvenile polyposis syndrome at the interface of SMAD8 and SMAD4. At right, yeast two-hybrid experiments test the interactions of one of the SMAD4 mutations (Y353S) with SMAD8 and RASSF5. The mutation is not predicted by ECLAIR to be at the SMAD4-RASS5 interface. (b) Superimposed docking results of two different interaction partners with TK1. The differentially predicted interfaces of TK1 with each of its partners correspond with the orientation of the docked poses. (c) The plot shows the fraction of disease mutation pairs in known (blue) or predicted (orange) interfaces that cause the same disease when mutations are within a given interaction interface compared to when mutations are not within an interaction interface. (d) The plot shows the fraction of disease mutation pairs in known (blue) or predicted (orange) interfaces that cause different diseases when mutations are in the same interaction interface compared to in different interaction interfaces (interaction with other proteins is not shown). (Significance determined by two-sided Z-test)

