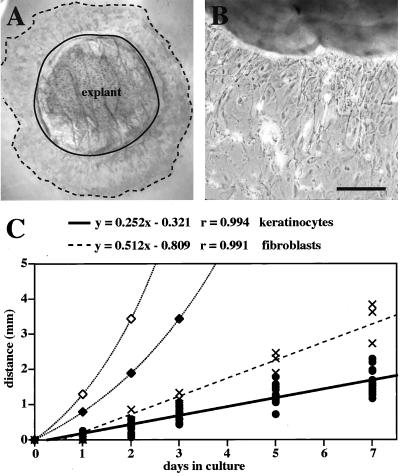
Figure 2.
Analysis of explants from newborn mice. (A) A 4-mm full-thickness punch biopsy was isolated, grown in medium for 7 d, and immunostained with antibodies directed against K17 to confirm the cells are keratinocytes. The solid line denotes the explant edge. The dotted line denotes the cells that are most distal to the explant. (B) Phase contrast microscopy of an unstained explant. Cells that have migrated onto the culture dish have an epithelioid appearance. Bar, 200 μm. (C) Distance between the explant edge and the most distal cells of the outgrowth was measured over time. The heavy solid line is a linear curve fit to the keratinocyte measurements (●). The dashed line is a linear curve fit to measurements of fibroblast outgrowth (×). A 24-h (⋄) or 36-h (♦) cell cycle time was used to calculate the theoretical curve for distance due to cell proliferation, distance = (Atotal/π)1/2 · (et/2τ).

