Abstract
Background
This study used magnetic resonance imaging (MRI) to monitor changes to brain metastases and investigate the imaging signs used to evaluate treatment efficacy and determine prognosis following radiotherapy for brain metastases from lung cancer.
Methods
A total of 60 non‐small cell lung cancer patients with brain oligometastases were selected. MRI scans were conducted before and 3, 6, 9, 12, 18, 24, and 30 months after radiotherapy. The tumor and peritumoral edema diameters, Cho/Cr values, elevation of the Lip peak value, and whether the island (yu‐yuan) sign or high‐signal ring were present on T2 fluid‐attenuated inversion recovery (FLAIR) imaging were recorded for each metastasis.
Results
The mortality risk was higher the earlier the maximum value of peritumoral edema diameter was reached, when there were fewer island signs, and when brain metastases did not present as tumor progression on imaging. There were significant differences in the average peritumoral edema diameter, apparent diffusion coefficient value, the number of elevated Lip peak values, and the number of T2 FLAIR imaging high‐signal rings in a year after radiotherapy in 14 patients with a survival period < 1 year compared to patients with a survival period > 2 years.
Conclusion
After radiotherapy for brain metastases, patients with the island sign had longer survival periods, high‐signal rings in T2 FLAIR, elevated Lip peaks, and reduced apparent diffusion coefficient values, indicating tumor necrosis. Increased diameter of metastases and Cho/Cr > 2 cannot serve as reliable indicators of brain metastasis progression.
Keywords: Brain metastasis, evaluation, lung cancer, MRI, treatment efficacy
Introduction
Lung cancer is the most common cause of cancer‐related mortality. Approximately 30–50% of patients develop brain metastases, for which prognosis is extremely poor.1, 2 Despite recent research indicating that the median survival period of patients with brain oligometastases treated with stereotactic radiosurgery (SRS) alone is longer than in patients treated in combination with whole‐brain radiation therapy (WBRT),3 WBRT combined with intensity‐modulated radiation therapy (IMRT) of the tumor site currently remains the primary treatment regimen for brain oligometastases from lung cancer.4 During the course of treatment for brain metastasis from lung cancer, a major concern is the lack of obvious criteria for distinguishing between tumor progression, tumor necrosis, and radiation‐induced brain injury following radiotherapy for brain metastases.5 Brain metastases often develop increased tumor volume, increased range of brain edema, and complicating neurological reactions following radiotherapy, and some patients are diagnosed with tumor progression and undergo further enhanced chemotherapy.6, 7 Studies of glioma have found that pseudoprogression of tumors can develop following radiotherapy or targeted therapy.8, 9 However, few studies have been conducted to examine radiological changes following radiotherapy for brain metastases. Currently, Response Evaluation Criteria in Solid Tumors (RECIST) version 1.1 is still used for radiological evaluation following radiotherapy for brain metastases; specifically, tumor progression is defined as a 20% increase in the sum of diameters and an absolute increase of 5 mm on MRI.6, 10 However, is this criterion actually suitable for evaluating progression after radiotherapy for brain metastases? Magnetic resonance spectroscopy (MRS) and diffusion‐weighted imaging (DWI) are considered important methods for distinguishing progression and pseudoprogression after radiotherapy for gliomas; are these suitable methods for metastases?9, 11, 12
Similar to gliomas, brain metastases contain a mixture of necrotic tumor tissue, radioactive damage, and surviving tumor cells after treatment.12 It is difficult to accurately distinguish between tumor necrosis and tumor residue and the proportion of tumor residue using current radiological methods. In addition, the overall principles of cancer treatment indicate that brain metastasis from lung cancer is an incurable stage IV tumor. Finding radiological signs that influence the evaluation of treatment efficacy and determination of prognosis following radiotherapy for brain metastasis would have great practical significance for distinguishing between tumor progression, tumor necrosis, and radioactive damage.
Methods
Included patients
Patients initially diagnosed with non‐small cell lung cancer (NSCLC) with synchronous or metachronous brain metastasis at our hospital between November 2014 and January 2016 were identified. Included patients did not undergo targeted therapy because of economic reasons or lack of genetic mutations. Primary lesions had been resected or stably controlled, and all initial Karnofsky performance scores were ≥ 80. All patients had ≤ 3 brain metastases. Primary lung cancer was confirmed by surgery, or lung or bronchoscopic biopsy. During the follow‐up period, primary lesions either disappeared or stabilized, and no new brain metastases developed over the treatment course. Non‐extracranial and extracranial metastases were stable or improved.
Brain metastases were diagnosed according to radiological manifestations, such as multiple lesions located in the corticomedullary border zone, annular or nodular enhancements, and large regions of accompanying low‐density peritumoral edema, which suggested an integrated radiologic‐clinical diagnosis of brain metastases. Eleven cases of isolated brain metastases were confirmed by surgical pathology.
The institutional review board of Shandong Cancer Hospital and Institute approved the research protocol. All patients provided informed consent.
Treatment course
Integrated treatment, primarily with chemotherapy and radiotherapy, was administered. WBRT and tumor site IMRT were used for radiotherapy. The overall dose for each metastasis was 50–60 Gy.
Research methods
Baseline scanning was performed within two weeks prior to radiotherapy, and at 3, 6, 9, 12, 18, 24, and 30 months after radiotherapy. At each time point before and after radiotherapy, the tumor diameter; peritumoral edema diameter; Cho/Cr value in the MRS sequence; and presence of high‐signal rings on T2 fluid‐attenuated inversion recovery (FLAIR) imaging, the island (yu‐yuan) sign, and elevated Lip peaks of each metastasis were evaluated and recorded. Each of these indices was entered into an Excel spreadsheet.
Magnetic resonance scanning protocol
A Philips Achieva 3.0T superconducting MR scanner (Philips Medical Systems, Andover, MA, USA) was used. The gradient field strength was 40 mT/m and 80 mT/s, the slew rate was 200 mT/m/ms and 100 mT/m/ms, and an eight‐channel cranial phased array coil was used.
Conventional T1WI (TR 250/TE 2.3 ms), T2WI (TR 2105/TE 80 ms), and T2WI‐FLAIR (TR 11000/TE 120 ms, TI 2800 ms) routine scans along the transverse axis were performed. Gadopentetate dimeglumine was used as a contrast agent, and a high‐pressure injector was used to rapidly inject the agent at a dose of 0.01 mmol/kg (0.2 mL/kg) through the cubital vein at an injection rate of 2 mL/s. After enhancement, T1WI transverse (TR 250/TE 2.3 ms), sagittal (TR 250/TE 2.3 ms), and coronal scans (TR 250/TE 2.3 ms) were performed, for which the number of signal averages (NSA) was 2, the field of view (FOV) was 23.0 × 23.0 cm, the slice thickness was 5.0 mm, and the spacing between slices was 1.0 mm. The b‐values used for DWI were 0 and 1000 s/mm2, the TR was 1965 ms, the TE was 48 ms, and an apparent diffusion coefficient (ADC) map was automatically generated by the system.
The point resolved spectroscopy sequence (2D‐PRESS) method was used for multivoxel MRS sequence scanning, with TR 2000 ms, TE 144 ms, FOV 23.0 × 23.0 cm, slice thickness 10 mm, number of excitations 1, and scan time of five minutes 50 seconds. The multivoxel MRS imaging range includes as much tumor tissue as possible and some normal tissue in the slice, but avoids the scalp, cranium, other tissues, ventricles, subarachnoid cisterns, vesicle formation, necrosis, bleeding, and large blood vessels as much as possible. The pre‐scan program automatically performed voxel shimming and water suppression scanning.
ADC value measurement: In the ADC map, regions of interest were placed in the region with the lowest ADC values in the largest section of the transverse axis of the lesion (deep colored regions) to obtain the ADC value.
Image post‐processing and data measurement
The raw data from the scans were transferred to the Philips EBW workstation for processing. Two radiological diagnostic physicians with at least 15 years of specialized neuroradiology experience evaluated the MRI images. Among enhanced transverse T1 weighted images, the slice with the maximum tumor diameter was determined and measured.
The sum of metastasis diameters was calculated by adding the diameters of all lesions for each patient. The time of maximum metastasis diameter indicates the time point at which the sum of metastasis diameters reached its maximum value during the follow‐up period for each patient. The peritumoral edema diameter refers to the maximum diameter of the peritumoral edema on transverse T2 FLAIR imaging, including the region of the tumor itself (Fig 1). The sum of peritumoral diameters for each patient was calculated by adding the peritumoral diameters. The time of maximum peritumoral diameter indicates the time point at which the sum of peritumoral diameters reached its maximum value during the follow‐up period for each patient.
Figure 1.
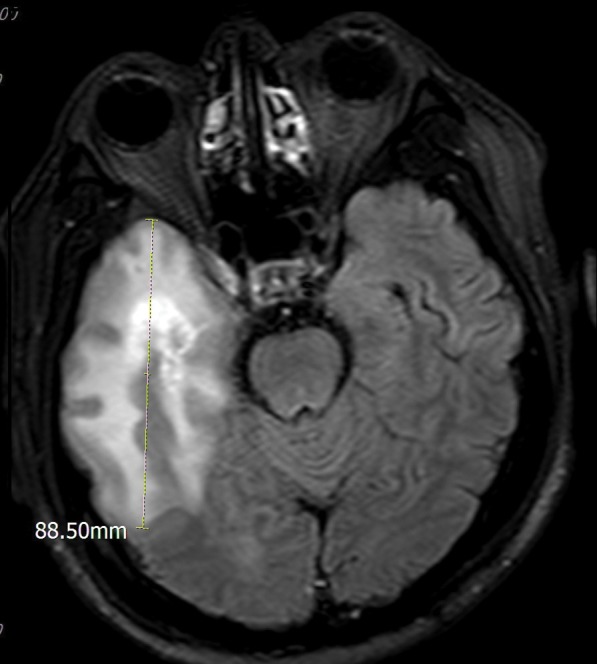
The method of measurement for peritumoral brain edema.
Island sign: After radiotherapy for brain metastases, the margins of the primary metastases become indistinct, exhibiting an irregular map‐like appearance and are primarily distributed along the white matter with residue in the gray matter. The margins of the lesions are indistinct on T1 weighted enhanced image, and the periphery are enhanced with gradually decreasing signal intensity from outside to inside. Brain edema with low signal at the periphery exhibits an island‐like appearance (Fig 2a,b).
Figure 2.

Correlation between island (yu‐yuan) sign and magnetic resonance pathology.
High‐signal ring in T2 FLAIR: After radiotherapy for brain metastases, annular or semiannular high‐signal intensity can appear at the edges of the lesion, which are clearer on the T2 FLAIR phase.
According to the RECIST guidelines (version 1.1), tumor progression is defined as a greater than 20% increase in the sum of diameters and an absolute increase of 5 mm or more.
Drawing of MRS regions of interest: The center of the multivoxel MRS voxel grid was placed at the largest region of the transverse section of the lesion. The Cho/Cr value of the lesion was recorded at the voxels closest to the enhanced region of the lesion. The Lip peak value is considered elevated if the Lip peak value of this voxel is higher than the height of the Cho, Cr, and N‐acetylaspartate peaks in the same pixels.
Follow‐up
Follow‐up was conducted on 79 patients until 31 December 2017; 19 patients did not meet the inclusion criteria. The follow‐up rate was 75.9%. A total of 119 lesions in 60 patients (33 men, 27 women) were included in the study. The follow‐up period ranged from 6 to 30 months. The median age of the patients was 62 years (range 32–83). The pathological types of primary lung cancer were squamous cell carcinoma (25 patients), adenocarcinoma (31 patients), and other type (4 patients: 1 adenosquamous carcinoma, 1 large cell carcinoma, and 2 patients pathologically diagnosed with NSCLC but the type was not confirmed). Surgical resection was performed for 11 individual brain metastases, of which six were confirmed by surgical pathology as necrotic tumors and five were confirmed as partial tumor necrosis. The pathological type of residual metastatic tissue was the same as that of the primary lung lesions, as shown in Table 1.
Table 1.
Variables
| Variable number | Factor | Values |
|---|---|---|
| x1 | Gender | Male = 1, female = 0 |
| x2 | Age | 32–83 years |
| x3 | Pathological type of primary lesion | 1 = adenocarcinoma, 2 = squamous cell carcinoma, 3 = other |
| x4 | Number of metastases | 1–3 |
| x5 | Sum of tumor diameters before treatment | 0.7–7.1 cm |
| x6 | Sum of peritumoral edema diameters before treatment | 1.1–11.5 cm |
| x7 | Maximum value of sum of metastasis diameters | 1.2–11.7 cm |
| x8 | Time of appearance of maximum value of sum of metastasis diameters | 0–30 months |
| X9 | Presence of radiological tumor progression during brain metastasis treatment | 0 = not present, 1 = present |
| x10 | Maximum value of sum of peritumoral edema diameters | 0–15.4 cm |
| x11 | Time of appearance of maximum value of sum of peritumoral edema diameters | 0–30 months |
| x12 | Number of appearances of Cho/Cr > 2 | 1–3 |
| x13 | Number of island (yu‐yuan) signs | 1–3 |
| x14 | Number of appearances of high‐signal ring in T2 FLAIRs | 1–3 |
| y | Survival period | 6–30 + months |
Zero months in x8 and x11 represent data prior to treatment. FLAIR, fluid‐attenuated inversion recovery.
Statistical analysis
All data was entered into SPSS version 22.0 (IBM Corp., Armonk, NY, USA). The life table method was used to calculate survival rate and single‐factor analysis was performed. A Cox proportional hazards regression model was used to perform multifactorial analysis of relevant factors influencing the survival rate. For analysis between groups, the Kolmogorov–Smirnov test was used to test for normality. The t‐test was used if P > 0.10, otherwise the Wilcoxon rank‐sum test was used. Differences of P < 0.05 were considered statistically significant.
Results
The median survival period of the included patients was 15.78 months. The one and two year survival rates were 71% and 20%, respectively. Gender, age, pathological type of the primary lesion, number of metastases, sum of tumor diameters before treatment, sum of peritumoral edema diameters before treatment, maximum value of sum of metastasis diameters, time of appearance of maximum value of sum of metastasis diameters, and number of appearances of Cho/Cr > 2 in the MRS sequence had no effect on the survival period. The mortality risk was higher the earlier the maximum value of peritumoral edema diameter was reached, when there were fewer island signs, and when brain metastases did not present as tumor progression on imaging (Table 2).
Table 2.
Variables in equation
| B | SE | Wald | df | Sig. | Exp(B) | 95% CI applied to Exp(B) | ||
|---|---|---|---|---|---|---|---|---|
| Lower | Upper | |||||||
| X1: Gender | −0.195 | 0.469 | 0.173 | 1 | 0.678 | 0.823 | 0.329 | 2.062 |
| X2: Age | 0.013 | 0.017 | 0.610 | 1 | 0.435 | 1.013 | 0.981 | 1.047 |
| X3: Pathological type | 0.212 | 0.352 | 0.363 | 1 | 0.547 | 1.237 | 0.620 | 2.467 |
| X4: Number of lesions | −0.018 | 0.211 | 0.007 | 1 | 0.931 | 0.982 | 0.649 | 1.485 |
| X5: Sum of tumor diameters before treatment | 0.370 | 0.251 | 2.171 | 1 | 0.141 | 1.448 | 0.885 | 2.370 |
| X6: Sum of peritumoral edema diameters before treatment | 0.335 | 0.229 | 2.140 | 1 | 0.144 | 1.398 | 0.892 | 2.189 |
| X7: Maximum value of sum of metastasis diameters | 0.203 | 0.156 | 1.705 | 1 | 0.192 | 1.225 | 0.903 | 1.663 |
| X8: Time of appearance of maximum value of sum of metastasis diameters | −0.032 | 0.029 | 1.177 | 1 | 0.278 | 0.969 | 0.915 | 1.026 |
| X9: Presence of radiological tumor progression during brain metastasis treatment | −0.838 | 0.354 | 5.596 | 1 | 0.018 | 0.432 | 0.216 | 0.866 |
| x10: Maximum value of sum of peritumoral edema diameters | −0.110 | 0.104 | 1.116 | 1 | 0.291 | 0.896 | 0.731 | 1.098 |
| x11: Time of appearance of maximum value of sum of peritumoral edema diameters | −0.139 | 0.043 | 10.637 | 1 | 0.001 | 0.870 | 0.801 | 0.946 |
| x12: Number of appearances of Cho/Cr > 2 | −0.245 | 0.301 | 0.663 | 1 | 0.416 | 0.783 | 0.434 | 1.412 |
| X13: Number of island (yu‐yuan) signs | −1.293 | 0.488 | 7.038 | 1 | 0.008 | 0.274 | 0.106 | 0.713 |
| X14: Number of appearances of high‐signal rings in T2 FLAIRs | 0.546 | 0.486 | 1.263 | 1 | 0.261 | 1.727 | 0.666 | 4.480 |
CI, confidence interval; FLAIR, fluid‐attenuated inversion recovery; SE, standard error.
The study patients were classified into three groups: Group 1: 25 lesions in 14 patients with a survival period ≤ 1 year; Group 2: 65 lesions in 33 patients with a survival period of 1–2 years; and Group 3: 27 lesions in 13 patients with a survival period > 2 years. There was a significant difference between groups 1 and 3 in the mean peritumoral edema diameter at nine months after radiotherapy (P < 0.05) (Fig 3). There were significant differences in mean ADC value among the groups at three and six months after radiotherapy (Fig 4), the number of elevated Lip peaks at 9 and 12 months after radiotherapy (P < 0.05) (Fig 5), and the number of high‐signal rings in T2 FLAIR at 12 months after radiotherapy (P < 0.05) (Fig 6). There was no significant difference among the groups in mean tumor diameter or mean Cho/Cr peaks. There was no significant difference between groups 1 and 2 and groups 2 and 3 in mean peritumoral edema diameter, ADC value, elevated Lip peaks, and number of T2 FLAIR phase high‐signal rings at any of the time points.
Figure 3.
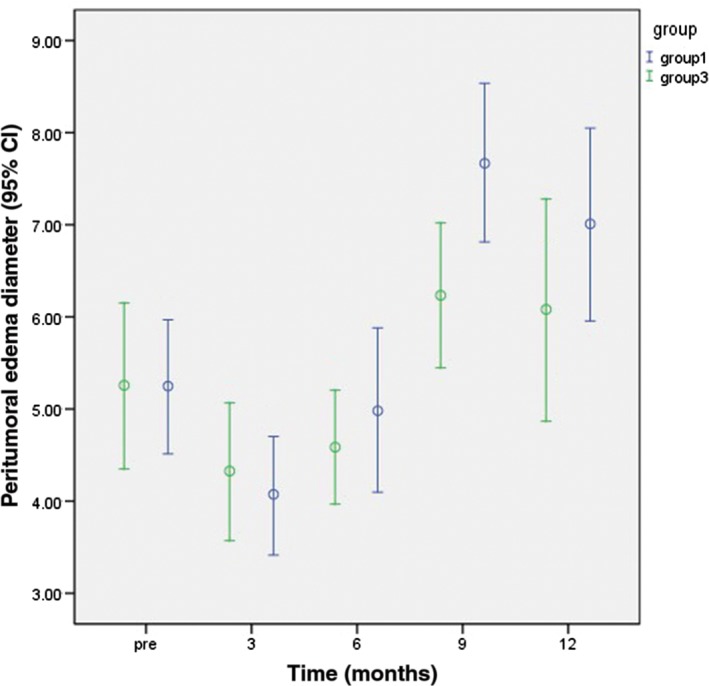
Comparison of the average sum of peritumoral edema diameters between Groups 3 and 1 at various time points one year after radiotherapy. CI, confidence interval.
Figure 4.
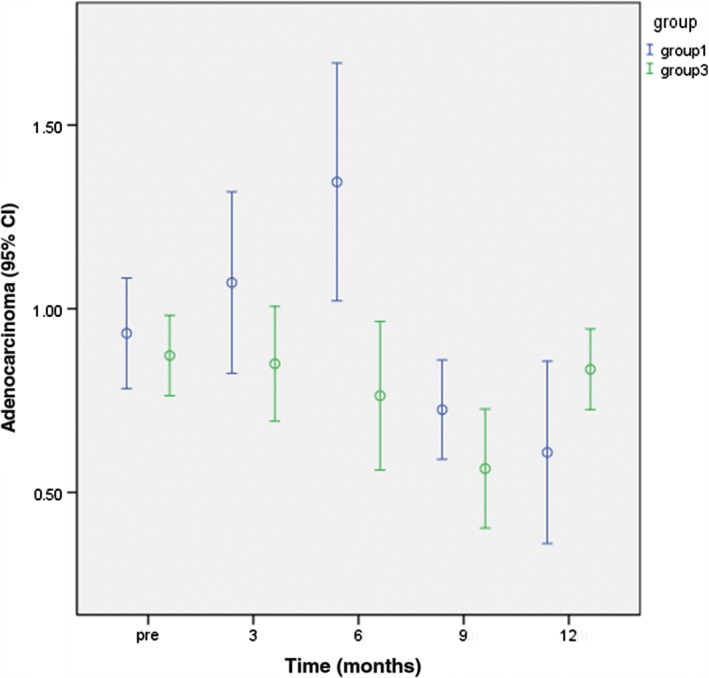
Comparison of apparent diffusion coefficient values between Groups 3 and 1 at various time points one year after radiotherapy. CI, confidence interval.
Figure 5.
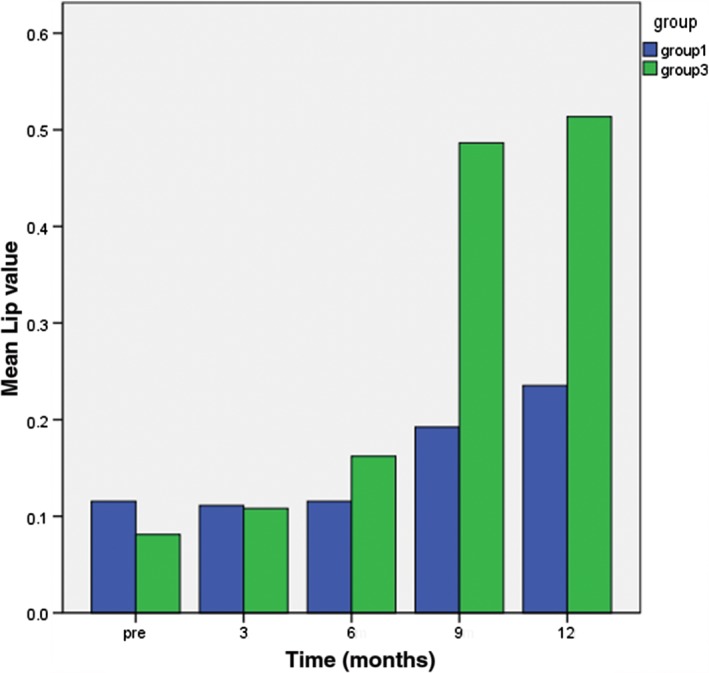
Comparison of the number of elevated Lip peaks between Groups 3 and 1 at various time points one year after radiotherapy.
Figure 6.
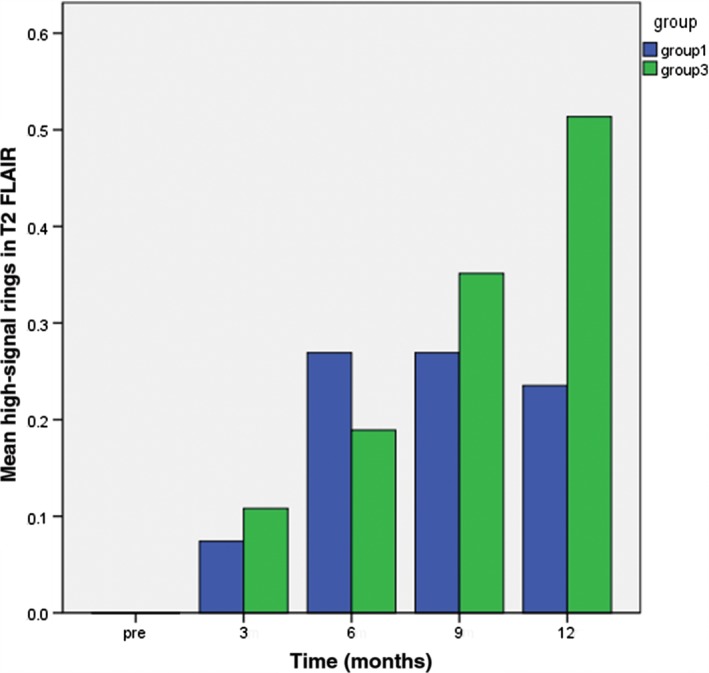
Comparison of the number of high‐signal rings in T2 fluid‐attenuated inversion recovery (FLAIR) appearing in Groups 3 and 1 at various time points one year after radiotherapy.
Discussion
Overall survival was used as the study endpoint for evaluating changes on MRI after radiotherapy for brain oligometastases from NSCLC. The results showed that gender, age, pathological type of the primary lesion, and number of metastases had no significant effect on survival (Table 2).
With respect to tumor volume, according to RECIST version 1.1, 69.2% (9/13) of the patients in Group 3 with survival periods > 2 years exhibited radiological tumor progression. Cox regression analysis showed an interesting result: patients with brain metastasis that presented with radiological tumor progression had a lower mortality risk. This implies that a 20% increase in the smallest sum of diameters and an absolute increase of 5 mm following treatment for brain metastases cannot serve as an absolute standard for brain metastasis progression. The increased tumor volume in patients with brain metastasis with relatively long survival periods is not true tumor progression, but instead may be partial pseudoprogression of the tumor.
Of the 119 patients with brain metastasis, 49 (41.2%) exhibited the island sign (Fig 2a,b), which is similar to the annular enhancement of lesions at necrotic tumors following treatment for glioma. In Group 3, the rate of appearance of the island sign was 70.4% (19/27). The sign appeared in six patients with pathologically confirmed radiation‐induced necrotic lesions. Pathology images show large regions of necrosis in the center of the lesion. Small blood vessels, bleeding, and glial cell proliferation are visible in the periphery (Fig 2c). Enhancement of the lesion edges may be related to the growth and bleeding of small vessels. The large region of necrosis in the center of the tumor lacks tumor vasculature and may be related to the inhomogeneous low signal in the central region of the island sign. It is worth noting that in 11 of the 19 patients in Group 3 with the island sign (51.9%) the tumor dissipated (Fig 7) during the follow‐up period, which further confirms that the island sign is a reliable indicator of tumor necrosis.
Figure 7.
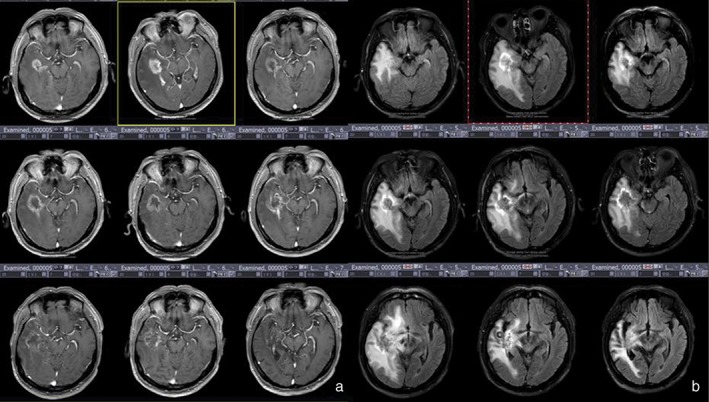
Group 3 patients had a survival period of ≥ 30 months and were confirmed with tumor necrosis by surgical pathology. (a) Enhanced T1 weighted imaging shows increased volume and diffusion of lesions after radiotherapy. (b) T2 fluid‐attenuated inversion recovery (FLAIR) imaging shows a high‐signal ring sign at the periphery of the lesion.
The results of Cox regression analysis show that the time of appearance of the maximum sum of peritumoral edema diameters significantly affects survival period; mortality risk increases with earlier appearance of the maximum sum of peritumoral edema diameters. Patients with survival periods > 2 years had a smaller mean peritumoral diameter at nine months after radiotherapy compared to patients with survival periods < 1 year; this difference was statistically significant (P < 0.05). There was no statistically significant difference in mean peritumoral edema diameter between Groups 1 and 2 before radiotherapy and at one year after radiotherapy. This implies that the time of appearance of maximum peritumoral edema diameter was latest in Group 3 patients, and brain edema may be a primary cause of death of Group 1 patients within a year.
Changes in tumor metabolites before and after glioma treatment can be monitored by MRS.11, 13 Studies have reported that the Cho/Cr ratio can distinguish between glioma pseudoprogression and tumor progression.9, 14 It is generally believed that the Cho/Cr ratio is > 2 after glioma treatment and that this is a reliable threshold to distinguish between tumor progression and pseudoprogression, but can MRS accurately evaluate pseudoprogression and tumor progression after radiotherapy for brain metastases? In the present study, all patients showed an overall trend of Cho/Cr increasing from low to high before radiotherapy to 3, 6, 9, and 12 months after radiotherapy. Cox regression analysis showed that Cho/Cr > 2 is not significantly correlated with mortality; thus, the Cho/Cr > 2 threshold is not reliable for distinguishing between brain metastasis pseudoprogression and tumor progression. In contrast, Group 3 patients had a higher rate of elevated Lip peak values at six and nine months after radiotherapy than Group 1 (P < 0.05); thus, elevated Lip peak values are a better sign to distinguish between pseudoprogression and tumor progression. Elevated Lip values represent increased lipids in lesions, and lipid composition significantly increases during the development of necrosis in brain metastases.12, 13
Previous studies have shown that decreased ADC values represent brain tumor recurrence or progression.15 However, we found a statistically significant difference in the mean ADC value of brain metastases at three and nine months after radiotherapy between Group 1 and 3 patients, with Group 3 significantly lower than Group 1. Acute radiation‐induced damage occurred after radiotherapy for brain metastases, and it is possible that acute vascular injury leads to coagulative necrosis of tumors, which presents as high DWI signals and low ADC values. In Group 3, ADC values began to decrease six months after radiotherapy, showing that radiation‐induced necrosis of brain metastases was more complete in Group 3. Such necrotic tumor tissue presents as diffusion restriction at early stages of necrosis.
In normal practice, if a high‐signal ring appears at the periphery of a lesion on the T2 FLAIR sequence following brain metastasis treatment, the prognosis is good. Significantly more high‐signal rings in T2 FLAIR were observed in Group 3 at 12 months after radiotherapy for brain metastasis than in Group 1; the incidence of high‐signal rings in T2 FLAIRs between the two groups was statistically significant 12 months after radiotherapy (P < 0.05). Pathology slides after surgery for necrotic brain metastatic lesions showed the appearance of annular bleeding in the periphery of the brain metastasis (Fig 2c). It is possible that this annular bleeding is the cause of the high‐signal ring in T2 FLAIRs.
Overall, our results indicate that the following radiological signs suggest tumor necrosis after radiotherapy for brain metastasis: (i) increased volume accompanied with increased peritumoral diameter of metastatic lesions at 3–20 months after conventional radiotherapy, and appearance of the island sign on enhanced scanning of brain metastases (Fig 8a); (ii) high‐signal ring in T2 FLAIRs at the lesion edges (Fig 8b); (iii) diffusion restriction on DWI sequence (Fig 8c), inhomogeneous high DWI signal, and low ADC values; and (iv) elevated Lip peaks in lesions (Fig 8d). These signs may be related to long‐term patient survival.
Figure 8.
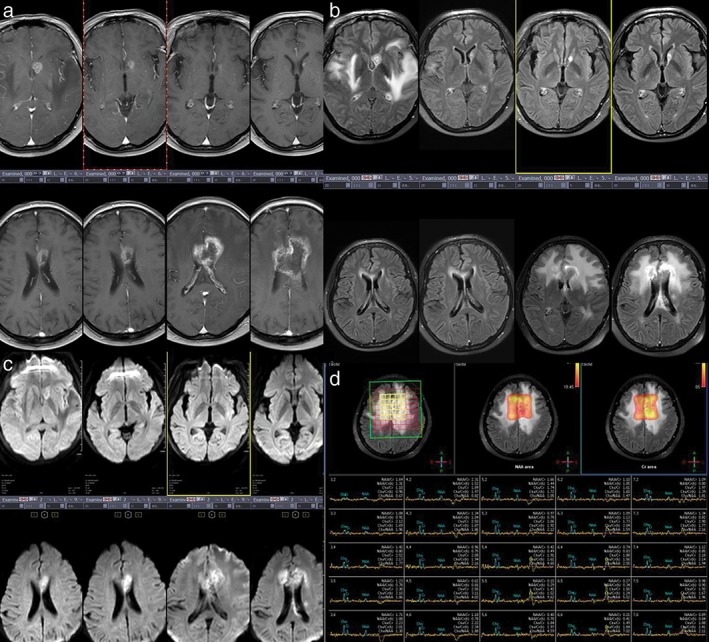
Group 3 patients. (a) T1 weighted images show the changes in brain metastatic lesions before and 3, 6, 9, 12, 18, 24, and 30 months after radiotherapy. (b) The island (yu‐yuan) sign appeared at 24 months; the high‐signal ring in T2 fluid‐attenuated inversion recovery (FLAIR) at 24 months; (c) diffusion was limited at 12 months; and (d) Cho/Cr > 2 at 36 months after brain metastasis radiotherapy.
Most patients have severe edema in the white matter one year or more after radiotherapy for brain metastases. These patients have significant neurological symptoms and significantly reduced Karnofsky performance scores. Group 3 patients had earlier and more systematic dehydration and required steroids and neurotrophic drugs compared to Group 1. Thus, for such patients with brain oligometastases from lung cancer that were administered standard doses of radiotherapy and in which the island sign appeared, Lip peaks were elevated, and the radiological volume of the tumor, the peritumoral diameter, and the number of high‐signal rings on T2 FLAIR were increased, measures should be taken to avoid neurotoxicity and alleviate brain edema, which is of greater benefit to patients than further radiochemotherapy.
Brain metastases are classified as stage IV lung cancer. Few patients undergo surgical resection of brain metastases, therefore sufficient pathological data are difficult to obtain. This was a limitation to our study.
After radiotherapy for brain metastases, patients with the island sign had longer survival periods, high‐signal rings in T2 FLAIR, elevated Lip peaks, and reduced apparent diffusion coefficient values, indicating tumor necrosis. Increased diameter of metastases and Cho/Cr > 2 cannot serve as reliable indicators of brain metastasis progression.
Disclosure
No authors report any conflict of interest.
Acknowledgments
This study was funded by Shandong Key Research (2017CXGC1209).
Contributor Information
Shuanghu Yuan, Email: yuanshuanghu@sina.com.
Jinming Yu, Email: sdyujinming@126.com.
References
- 1. Torre LA, Siegel RL, Jemal A. Lung cancer statistics. Adv Exp Med Biol 2016; 893: 1–19. [DOI] [PubMed] [Google Scholar]
- 2. Yousefi M, Bahrami T, Salmaninejad A, Nosrati R, Ghaffari P, Ghaffari SH. Lung cancer‐associated brain metastasis: Molecular mechanisms and therapeutic options. Cell Oncol (Dordr) 2017; 40: 419–41. [DOI] [PubMed] [Google Scholar]
- 3. Halasz LM, Uno H, Hughes M et al Comparative effectiveness of stereotactic radiosurgery versus whole‐brain radiation therapy for patients with brain metastases from breast or non‐small cell lung cancer. Cancer 2016; 122: 2091–100. [DOI] [PMC free article] [PubMed] [Google Scholar]
- 4. Patil CG, Pricola K, Sarmiento JM, Garg SK, Bryant A, Black KL. Whole brain radiation therapy (WBRT) alone versus WBRT and radiosurgery for the treatment of brain metastases. Cochrane Database Syst Rev 2017; 9: CD006121. [DOI] [PMC free article] [PubMed] [Google Scholar]
- 5. Lin NU, Lee EQ, Aoyama H et al Challenges relating to solid tumour brain metastases in clinical trials, part 1: Patient population, response, and progression. A report from the RANO group. Lancet Oncol 2013; 14: e396–406. [DOI] [PubMed] [Google Scholar]
- 6. Lin NU, Lee EQ, Aoyama H et al Response assessment criteria for brain metastases: Proposal from the RANO group. Lancet Oncol 2015; 16: e270–8. [DOI] [PubMed] [Google Scholar]
- 7. Eisele SC, Wen PY, Lee EQ. Assessment of brain tumor response: RANO and its offspring. Curr Treat Options Oncol 2016; 17 (7): 35. [DOI] [PubMed] [Google Scholar]
- 8. Wen PY, Macdonald DR, Reardon DA et al Updated response assessment criteria for high‐grade gliomas: Response assessment in neuro‐oncology working group. J Clin Oncol 2010; 28: 1963–72. [DOI] [PubMed] [Google Scholar]
- 9. Matsusue E, Fink JR, Rockhill JK, Ogawa T, Maravilla KR. Distinction between glioma progression and post‐radiation change by combined physiologic MR imaging. Neuroradiology 2010; 52: 297–306. [DOI] [PubMed] [Google Scholar]
- 10. Nishino M, Jagannathan JP, Ramaiya NH, Van den Abbeele AD. Revised RECIST guideline version 1.1: What oncologists want to know and what radiologists need to know. AJR Am J Roentgenol 2010; 195: 281–9. [DOI] [PubMed] [Google Scholar]
- 11. Lotumolo A, Caivano R, Rabasco P et al Comparison between magnetic resonance spectroscopy and diffusion weighted imaging in the evaluation of gliomas response after treatment. Eur J Radiol 2015; 84: 2597–604. [DOI] [PubMed] [Google Scholar]
- 12. Kumar AJ, Leeds NE, Fuller GN et al Malignant gliomas: MR imaging spectrum of radiation therapy‐ and chemotherapy‐induced necrosis of the brain after treatment. Radiology 2000; 217: 377–84. [DOI] [PubMed] [Google Scholar]
- 13. Liimatainen T, Hakumäki JM, Kauppinen RA, Ala‐Korpela M. Monitoring of gliomas in vivo by diffusion MRI and (1)H MRS during gene therapy‐induced apoptosis: Interrelationships between water diffusion and mobile lipids. NMR Biomed 2009; 22: 272–9. [DOI] [PubMed] [Google Scholar]
- 14. Fink JR, Carr RB, Matsusue E et al Comparison of 3 Tesla proton MR spectroscopy, MR perfusion and MR diffusion for distinguishing glioma recurrence from posttreatment effects. J Magn Reson Imaging 2012; 35: 56–63. [DOI] [PubMed] [Google Scholar]
- 15. Chen L, Liu M, Bao J et al The correlation between apparent diffusion coefficient and tumor cellularity in patients: A meta‐analysis. PLoS One 2013; 8: e79008. [DOI] [PMC free article] [PubMed] [Google Scholar]


