
Figure 4.
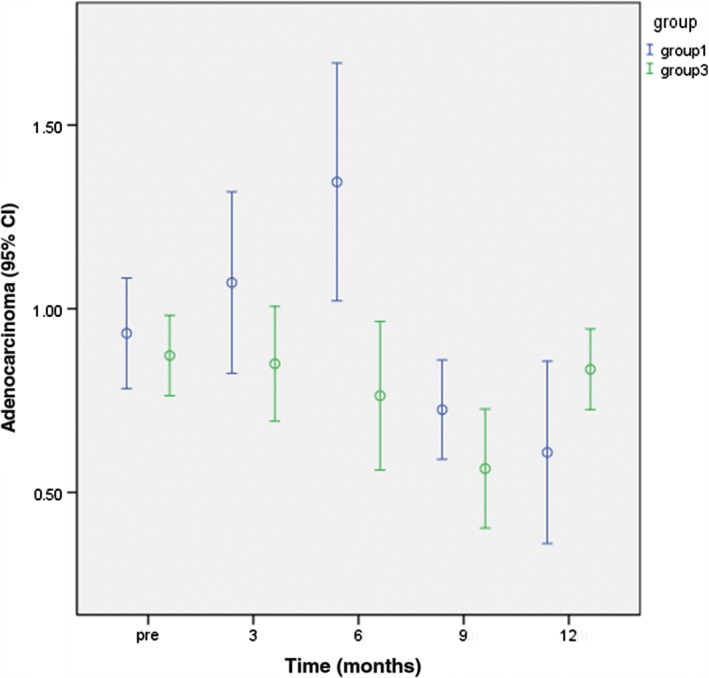
Comparison of apparent diffusion coefficient values between Groups 3 and 1 at various time points one year after radiotherapy. CI, confidence interval.
Official websites use .gov
A
.gov website belongs to an official
government organization in the United States.
Secure .gov websites use HTTPS
A lock (
) or https:// means you've safely
connected to the .gov website. Share sensitive
information only on official, secure websites.
Comparison of apparent diffusion coefficient values between Groups 3 and 1 at various time points one year after radiotherapy. CI, confidence interval.