
FIGURE 5.
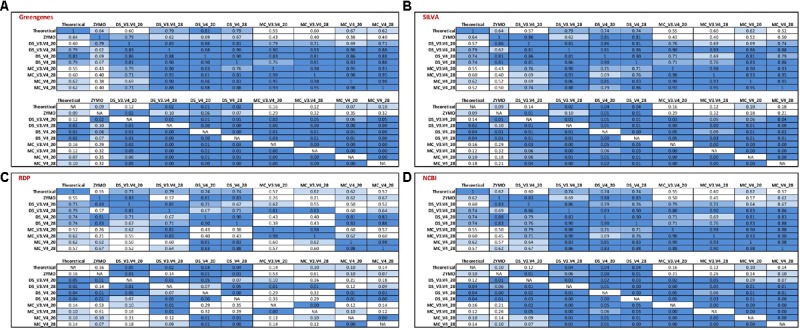
Correlation matrix of Spearman’s correlation coefficient values between the theoretical mock community compositions (Theoretical), Zymo 16S rRNA sequencing data (Zymo), mock community cells extracted using the RBBC method (MC), and mock community DNA (DS) amplified using primers targeting the V3–V4 and V4 region of the 16S rRNA gene with 20 and 28 cycles. Sequences were clustered into OTUs at 97% identify and taxonomic classification of OTUs was conducted with the RDP classifier within QIIME analyses utilizing the (A) Greengenes, (B) SILVA, (C) RDP, and (D) NCBI 16S rRNA databases. Values with a positive significant correlation are illustrated with shaded color while insignificant correlations are blank.