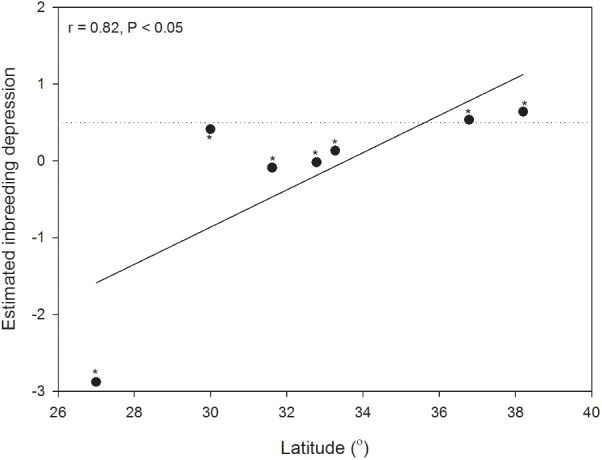
FIGURE 3.

Latitudinal variations of the estimated inbreeding depression (line of linear regression) in seven populations of H. elliptica. Dotted line indicates the theoretically predicted threshold (0.5) below which selfing should evolve, and asterisk indicates the significant difference between the estimated inbreeding depression and the theoretically predicted threshold (0.5).
