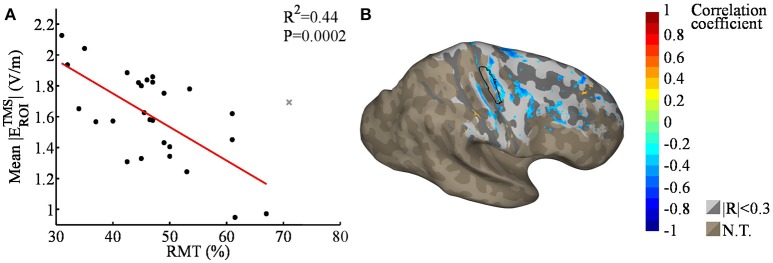
Figure 6.
(A) Regression plot of the mean TMS EF strengths within the ROI [black outlined area in (B)], as a function of the RMT; the gray cross marks the outlier that was omitted from the analysis. The average TMS EF strength was found to correlate significantly with RMT. (B) Nodewise correlation between individual RMT and TMS EFs; correlation coefficients with |R| > 0.3 are shown in color, smaller coefficients in gray, and unstudied areas (average TDCS EF lower than 50% of the maximum) in brown (N.T.). The shading in the gray/brown areas represents the gyral structure of the brain (dark = sulci, light = gyri). None of the correlations were significant with 5% FDR.

