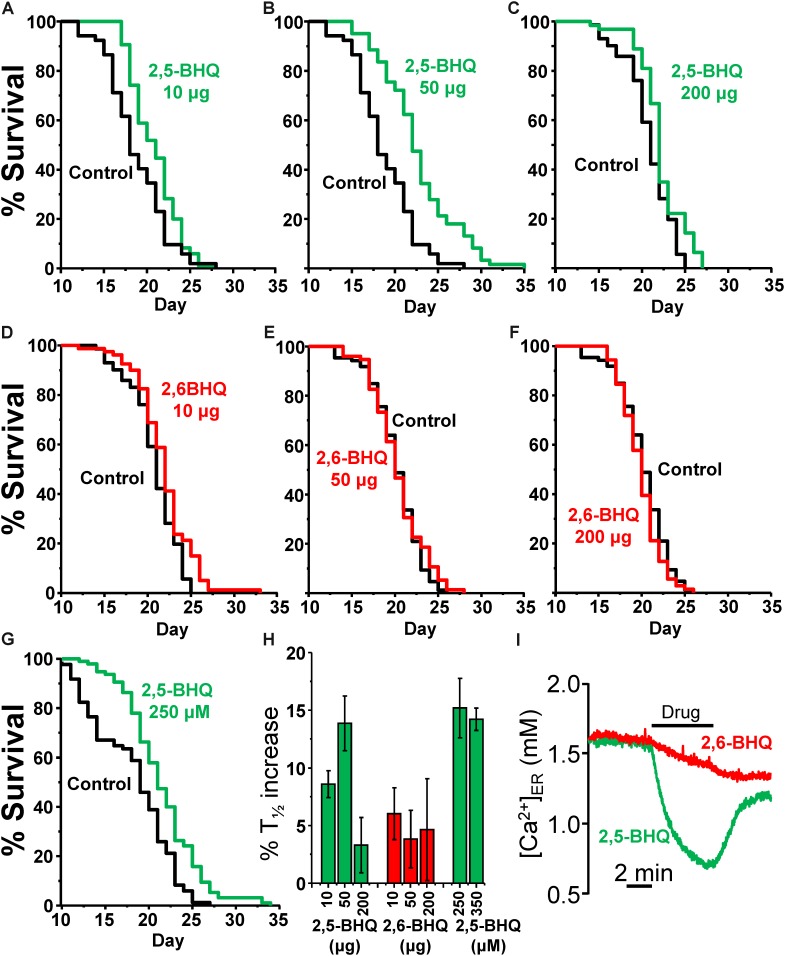
FIGURE 1.
Effects of 2,5-BHQ and 2,6-BHQ on survival in C. elegans. Panels A–F show representative survival plots corresponding to parallel lifespan assays performed using γ-cyclodextrin-inclusion compounds in the following conditions: Control/2,5-BHQ (A:10 μg; B:50 μg; C:200 μg) and Control/2,6-BHQ (D:10 μg; E:50 μg; F:200 μg), respectively. (G) shows a representative survival plot from a Control/2,5-BHQ lifespan assay in which 250 μM 2,5-BHQ was dissolved in the NGM agar. The assays shown correspond to those marked in bold in Table 1. (H) shows the mean increase in survival obtained in a series of lifespan assays of each kind as those shown in the figure (more details of each assay in Table 1). (I) shows the effect of 10 μM of either 2,5-BHQ or 2,6-BHQ on the [Ca2+]ER level in HeLa cells. This experiment is representative of 6-7 similar ones.

