
Figure 2.
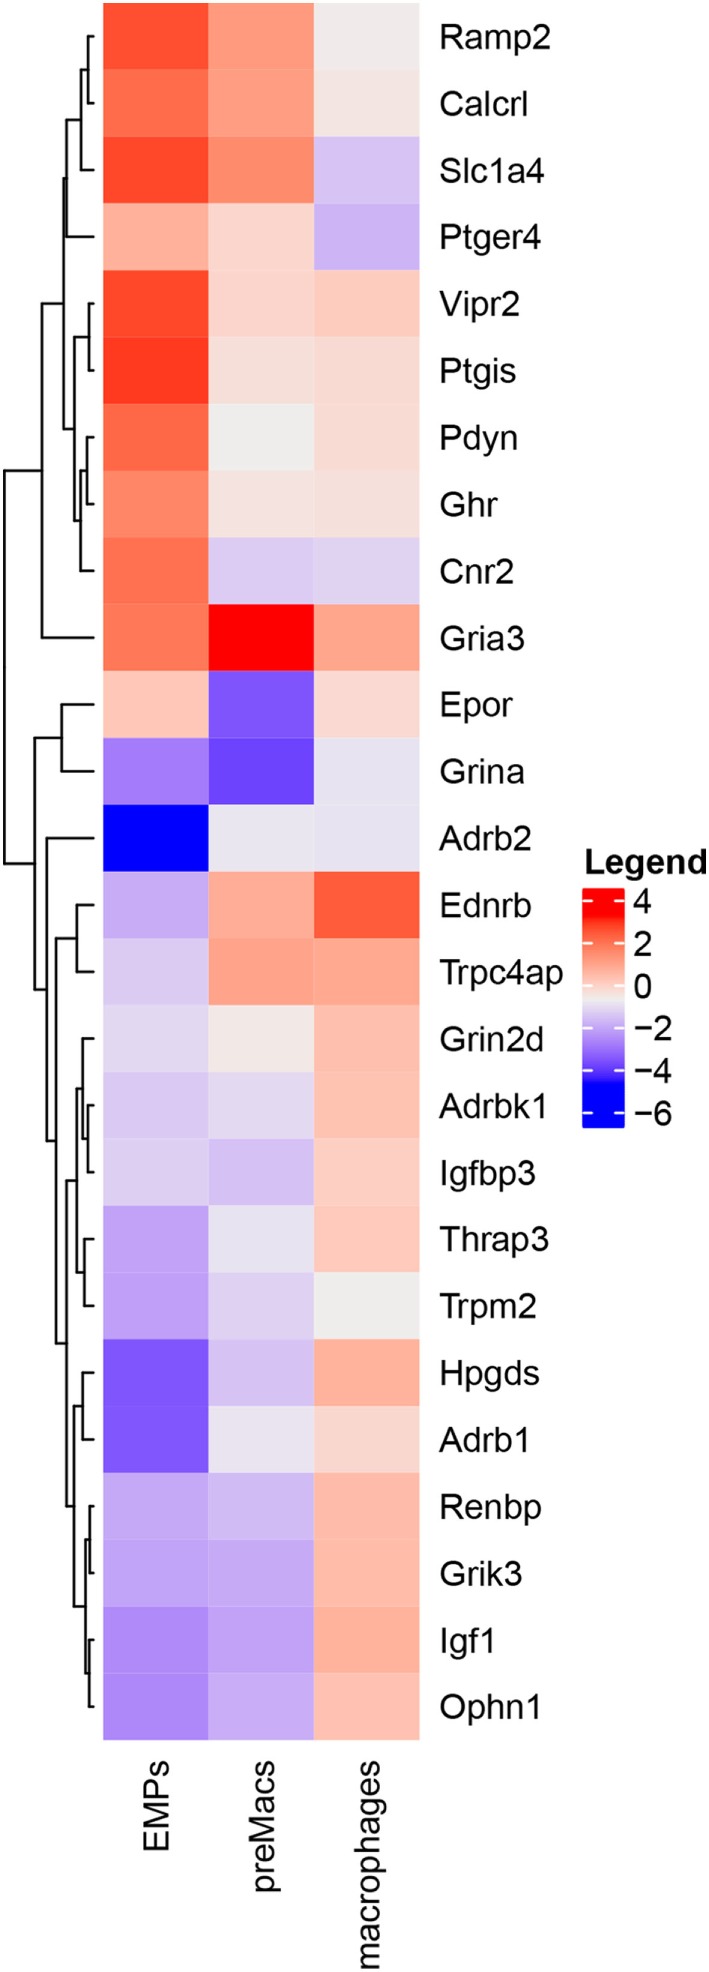
Neuroendocrine-associated genes are differentially expressed during macrophage differentiation. Heatmap of RNA-Seq profile filtered by keywords from Mass et al. (9) depicting hierarchically clustered relative gene expression (log2) in erythro-myeloid progenitors, pre-macrophages (preMacs), and macrophages. Levels of expression are represented by colors in which red, white, and blue indicate high, intermediate, and low intensities, respectively.