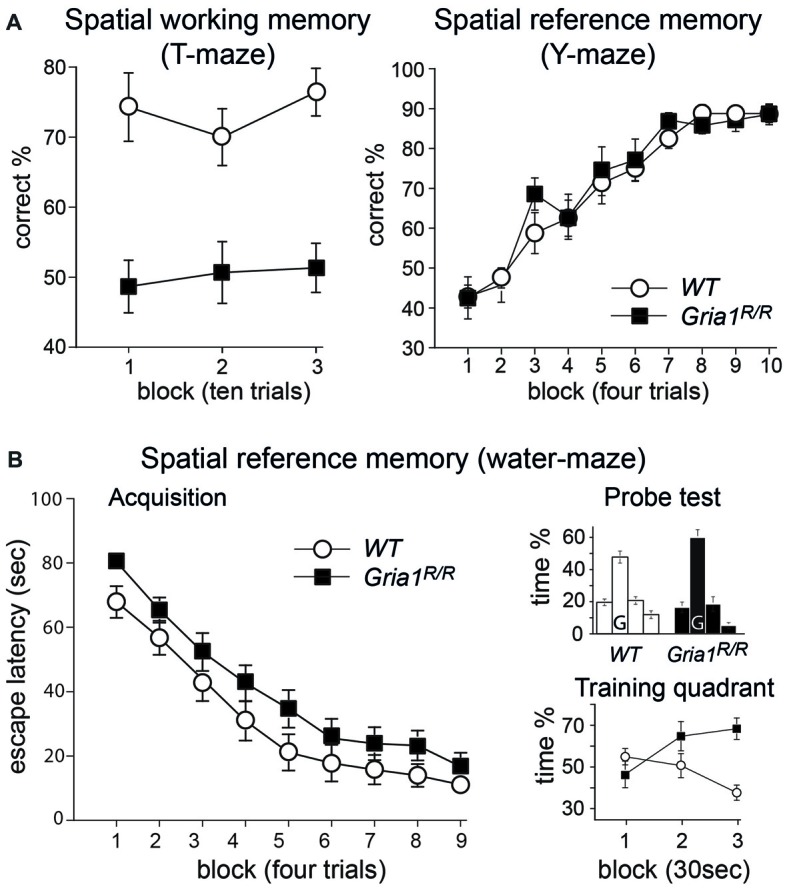
Figure 5.

Spatial memory in Gria1R/R mice. (A) Left: Gria1R/R mice are impaired on a spatial working memory task on the elevated T-maze. Mean percentage correct responses (± SEM) for WT littermates (white circles; n = 14) and Gria1R/R mice (black squares; n = 15) during spatial non-matching to place testing on the elevated T-maze. Right: Gria1R/R mice show normal spatial reference memory acquisition on the elevated Y-maze. Mean percentage of correct responses (± SEM) during acquisition of an appetitive spatial reference memory task for male WT littermates (white circles; n = 8) and Gria1R/R mice (black squares; n = 7). (B) Left: Gria1R/R mice acquired a standard spatial reference memory version of the Morris water-maze task. Mean escape latency (± SEM) for each day of testing during acquisition for WT littermates (white circles; n = 14) and Gria1R/R mice (black squares, n = 15). Right, top: mean percentage of time (± SEM) spent in the four quadrants of the pool during the 90 s probe test, conducted at the end of spatial training (after 36 trials) for WT littermates (left; n = 14) and Gria1R/R mice (right; n = 15). The platform had previously been located in the training quadrant (G) during acquisition. Right, bottom: mean percentage of time (± SEM) spent in the training quadrant during the three 30 s time blocks of the 90 s probe trial by WT littermates (white circles; n = 14) and Gria1R/R mice (black squares, n = 15).
