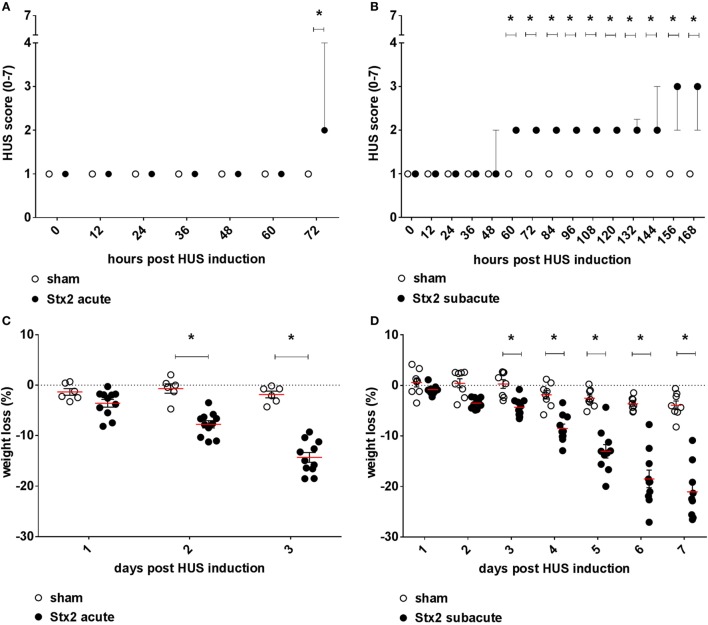
Figure 2.
Clinical presentation of C57BL/6J mice subjected to different Stx2 regimens. Clinical presentation was assessed by a score ranging from 1 = very active to 7 = dead for the (A) acute model (sham n = 6, Stx2 n = 11) and (B) subacute model (sham n = 8, Stx2 n = 10). (A,B) Data are expressed as median ± interquartile range for n observations. *p < 0.05 for sham vs. Stx2 at each respective time point (Mann–Whitney U-test). Weight loss of C57BL/6J wild-type mice was assessed every 24 h for the (C) acute model (sham n = 6, Stx2 n = 11) and the (D) subacute model (sham n = 8, Stx2 n = 10). (C,D) Data are expressed as mean ± SD for n observations. *p < 0.05 for sham vs. Stx2 at each respective time point (two-way ANOVA with Bonferroni post hoc test).

