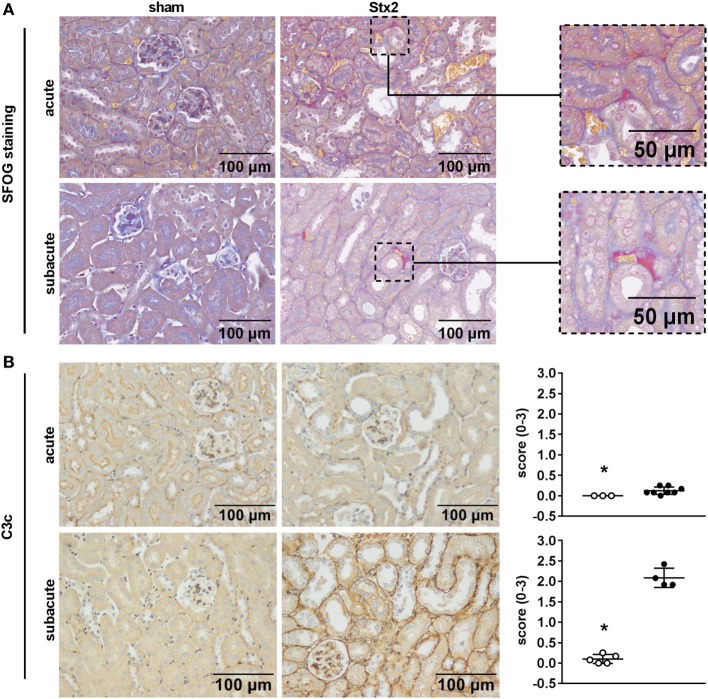
Figure 8.
Indicators of thrombus formation and complement activation in C57BL/6J mice subjected to different Stx2 regimens. (A) Representative images (scale bar 100 µm) of SFOG staining in renal sections. Thrombus formation was observed in Stx2 groups of both models (see zoomed areas on the right, scale bar 50 µm). (B) Representative images (scale bar 100 µm) of immunohistochemical detection and quantification of C3 and C3b complement deposition by C3c staining in renal sections of C57BL/6J wild-type mice are depicted (acute: sham n = 3, Stx2 n = 8; subacute: sham n = 5, Stx2 n = 4). *p < 0.05 for sham (white dots) vs. Stx2 (black dots; Mann–Whitney U-test).

