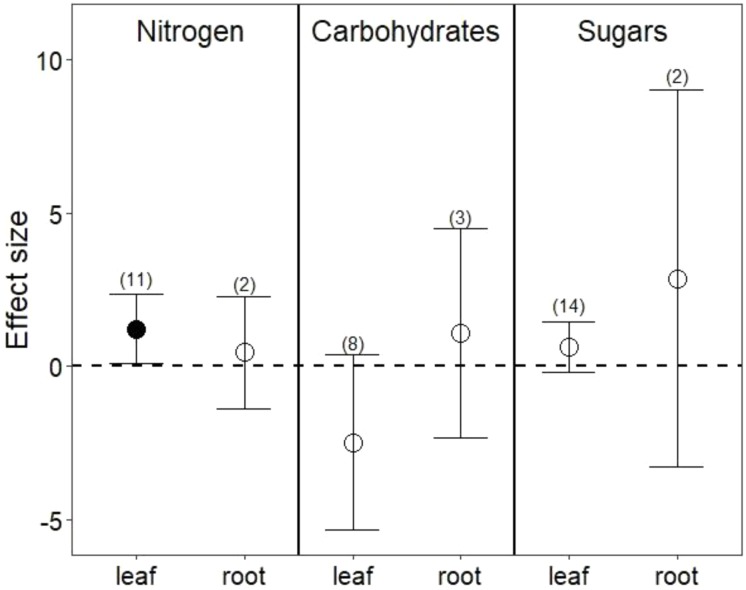
FIGURE 2.
Drought effects on nitrogen content, complex carbohydrates, and sugars for leaves and roots. Numbers in parentheses represent the number of studies considered. Mean effect sizes are shown with 95% confidence intervals (CIs). Effects are considered significant if their associated CIs do not overlap zero (dashed line) and are illustrated with solid circles.

