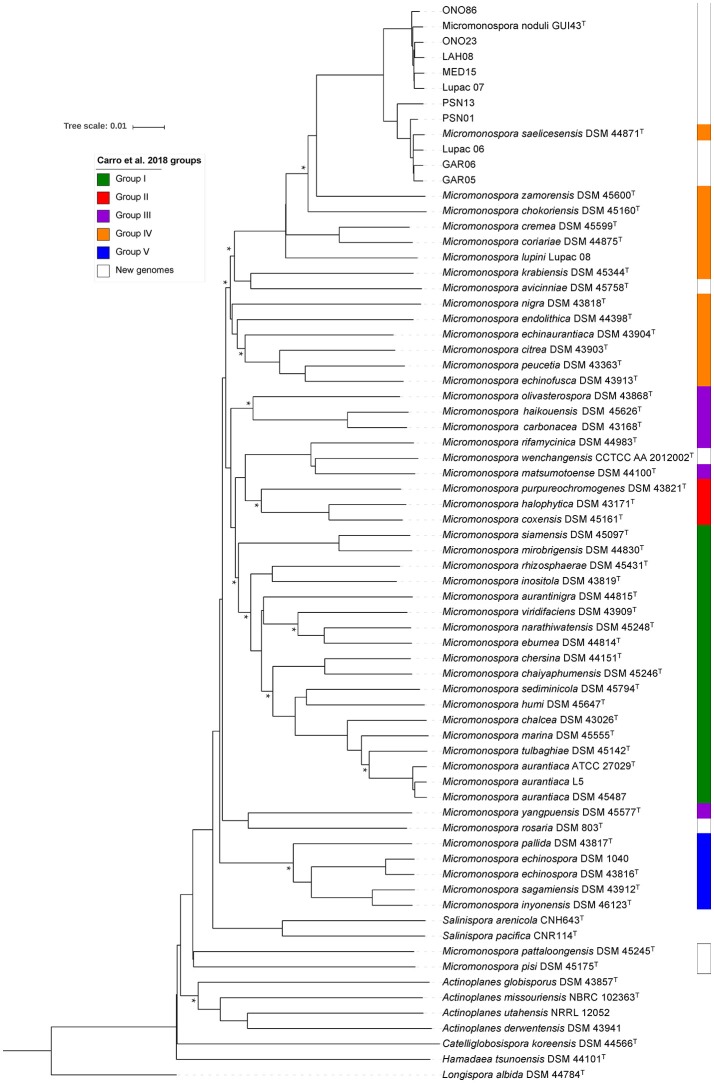
Figure 5.
Whole genome-sequence based phylogenomic tree constructed with the GBDP tool (see main text for details). Colors on the right side represent groups described in Carro et al. (2018). Asterisks represent conserved nodes between this tree and the core genome phylogenetic tree.

