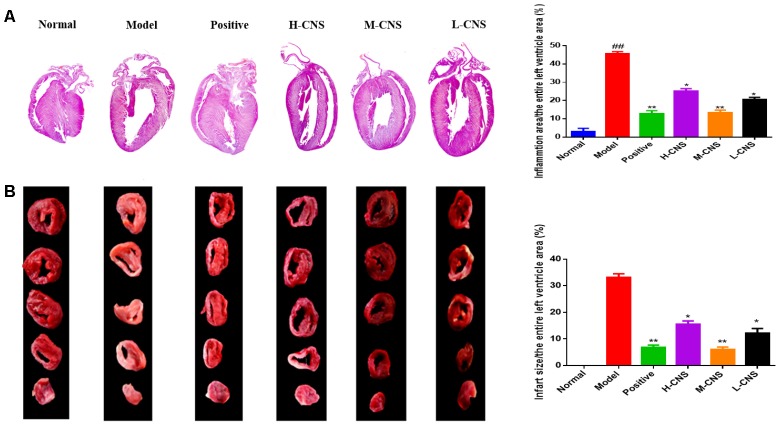
FIGURE 2.
(A) Representative photomicrographs of cardiac tissue sections stained with H&E, (n = 3/group). Values expressed as the mean ± SD. Significance was assessed with a two-tailed Student’s t-test: ##p < 0.01 vs. the normal group; ∗p < 0.05, ∗∗p < 0.01 vs. the model group. (B) Infarct size of rats in each group assessed by TTC assay. The infarcted tissues remained white, whereas normal tissues were stained red (n = 3/group). Values expressed as the mean ± SD. Significance was assessed with a two-tailed Student’s t-test: ∗p < 0.05, ∗∗p < 0.01 vs. the model group.

