
Figure 3.
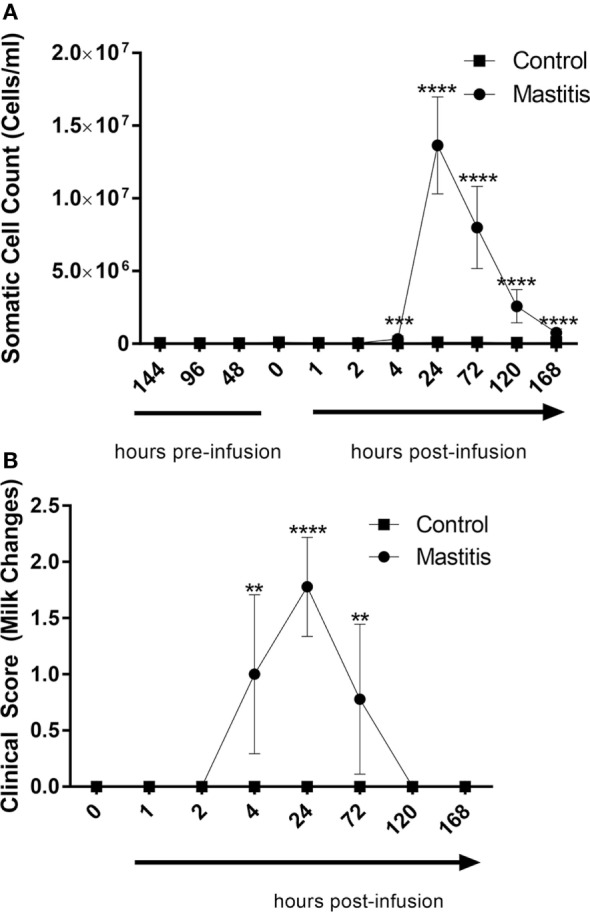
Milk somatic cell counts (SCCs) and milk change scores before and after infusion with lipopolysaccharide or physiological saline solution. (A) SCCs were determined using an automatic milk cell counter (n = 6–9). (B) Milk changes were scored on a scale of 0–3 (n = 9). Results are given as mean (±SD). *p < 0.05; **p < 0.01; ***p < 0. 001; ****p < 0.0001 [statistical analysis (A): multiple t-test; (B): Mann–Whitney].