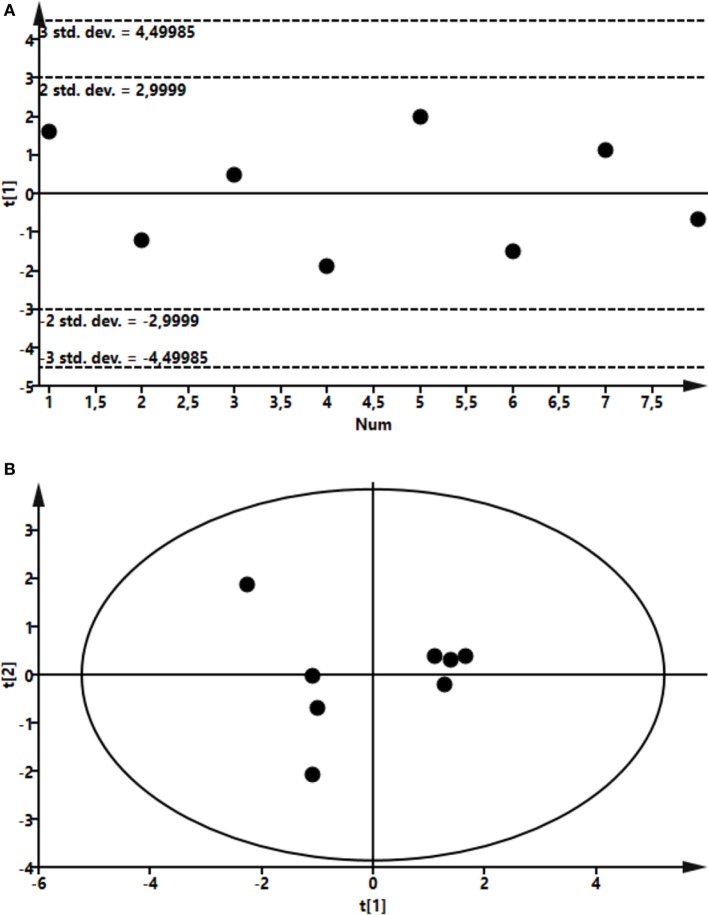
Figure 6.
Score plot of the partial least-squares analysis (PLS) model fitted to compare plasma metabolic profile between lipopolysaccharide (LPS) and control group. Plasma was recovered from LPS-infused and control animals followed by metabolomics analysis. (A) Profile at 4 h. Model parameter for one component fitted were as follow: R2Y = 0.86; Q2 = 0.74; cross-validated ANOVA, p = 0.03. Below control, above LPS samples. (B) Profile at 24 h. Model parameter for three components fitted were as follow: R2Y = 0.98; Q2 = 0.93; cross-validated ANOVA, p = 0.08. Left control, right LPS samples.

