Figure 3.

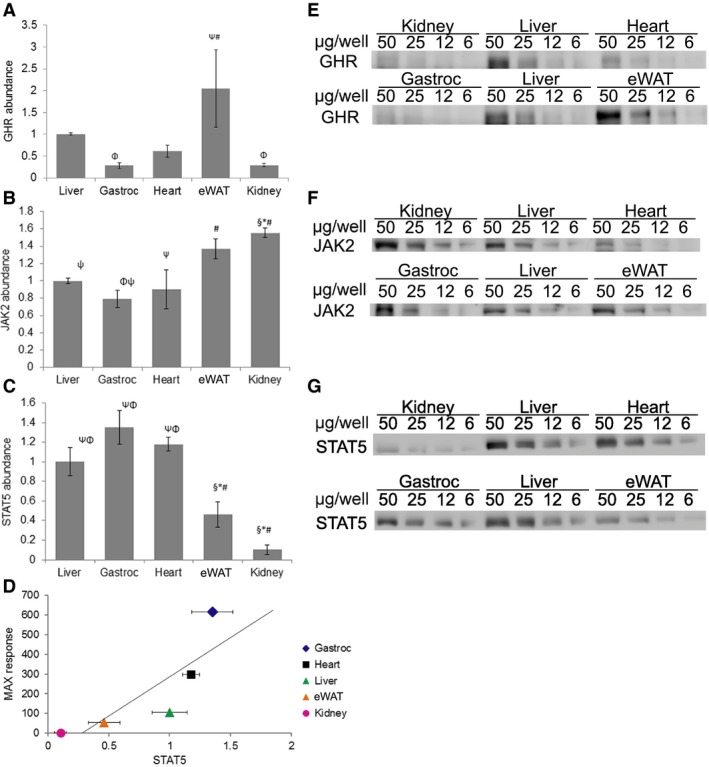
GH signaling components. Densitometry analysis and representative blots of tissue‐specific comparison of protein abundance for (A,E) GHR, (B,F) JAK2, and (C,G) STAT5 (relative to liver) (mean ± SEM; n = 5). Significance: All symbols represent P < 0.05 compared to: *, liver; #, gastrocnemius; §, heart; Φ, eWAT; and Ψ, kidney. (D) Linear regression analysis displaying the correlation between tissue‐specific MAX response and STAT5 (mean; n = 5) abundance (correlation coefficient: + 0.83; P = 0.082).
