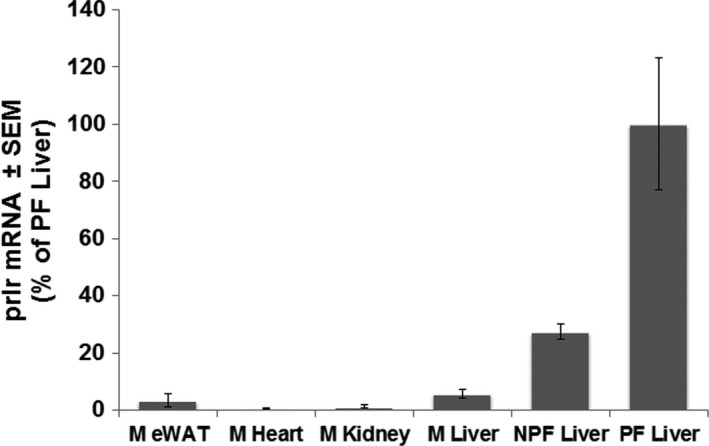
Figure 5.

Comparison of PRLR mRNA expression between the male mouse tissues and with livers from pregnant and nonpregnant female mice. M, male; NPF, nonpregnant virgin female; PF, pregnant female. Data represented as mean ± SEM; n = 3‐5 for each condition.
