FIG 8.
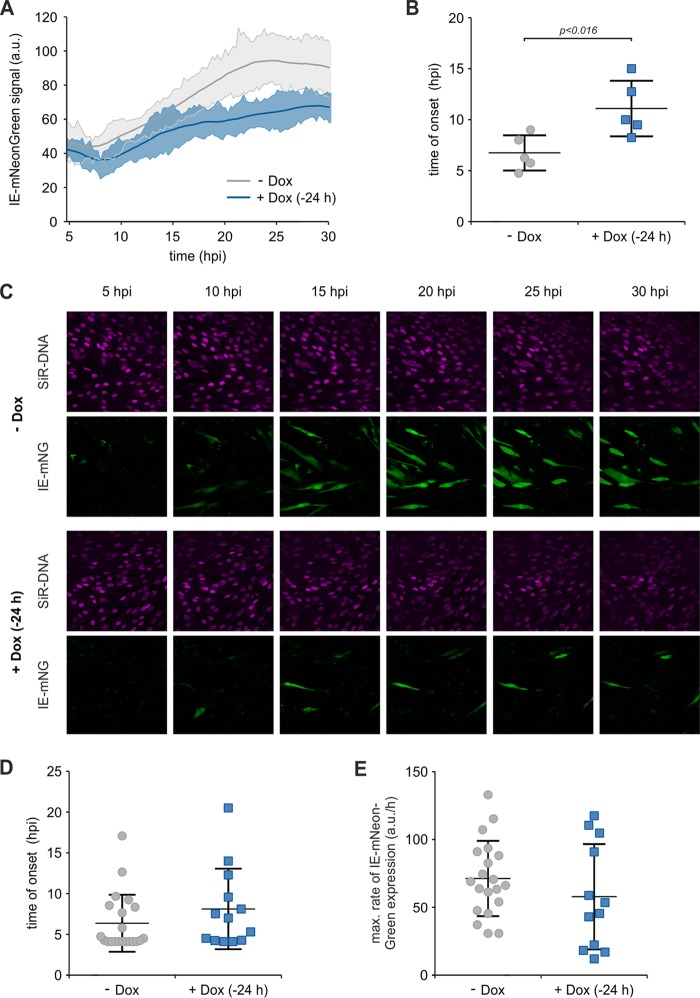
SPOC1 overexpression completely abrogates the onset of viral IE gene expression. HFF/SPOC1 (Tet-On) cells were seeded in live-cell imaging chamber slides, and SPOC1 overexpression was induced with doxycycline 24 h prior to infection with the recombinant reporter virus TB40/E-IE-mNeonGreen at an MOI of 0.05. In parallel, untreated cells (−Dox) were used as controls. For visualization of cell nuclei, SiR-DNA (Spirochrome AG, Stein am Rhein, Germany) was added 2 h prior to infection. Infection was monitored in real time, while images of 5 fields under each condition were acquired every 15 min for up to 30 h. (A) The acquired stacks of time series for all fields were automatically analyzed by using an ImageJ macro. Solid lines display a three-point average smoothing of the IE-mNeonGreen signal from 5 fields, with standard deviations of the average. a.u., arbitrary units. (B) Scatter dot plots showing the distribution of signal onset in each field of control (−Dox) and SPOC1-overexpressing (+Dox) (−24 h) HFFs. Statistical analysis was performed with an unpaired nonparametric t test (Mann-Whitney test). (C) Representative images taken from the time series (5 to 30 hpi). (D and E) Manual single-cell tracking was performed with ImageJ, and data sets were analyzed by using GraphPad Prism 6. (D) After analysis of the area under curve, the onset of IE gene expression was defined as the first time point when the signal crossed the baseline. (E) The maximal rate of gene expression was assessed by logistic growth curve fitting and subsequently calculating the incline at its inflection point. Statistical analysis was performed with an unpaired nonparametric t test (Mann-Whitney test).

