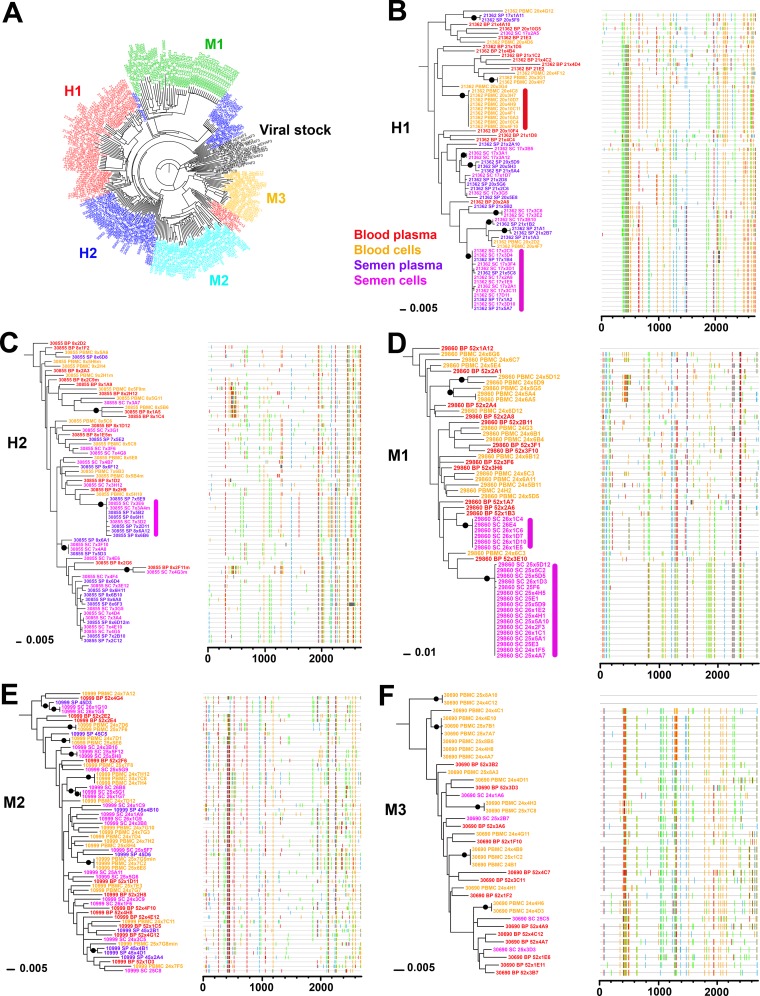
FIG 2.
Phylogenetic analysis of blood and semen sequences. (A) Maximum likelihood phylogenetic tree generated from all subject sequences (blood and semen) together with viral stock demonstrating absence of cross-contamination (H1, red; H2, dark blue; M1, green; M2, light blue; M3, orange; viral stock, black). (B to F) Maximum likelihood phylogenetic trees (left) and Highlighter plots (right) generated from sequences derived from blood (peripheral blood mononuclear cells, orange; blood plasma, red) and semen (semen cells, purple; semen plasma, pink) of macaques H1 (B), H2 (C), M1 (D), M2 (E), and M3 (F). A clonal amplification-like profile is indicated by a solid bar. Filled circles indicate branches with bootstrap values of ≥70%. The tree was rooted using the viral inoculum sequences (not shown for visual clarity).

