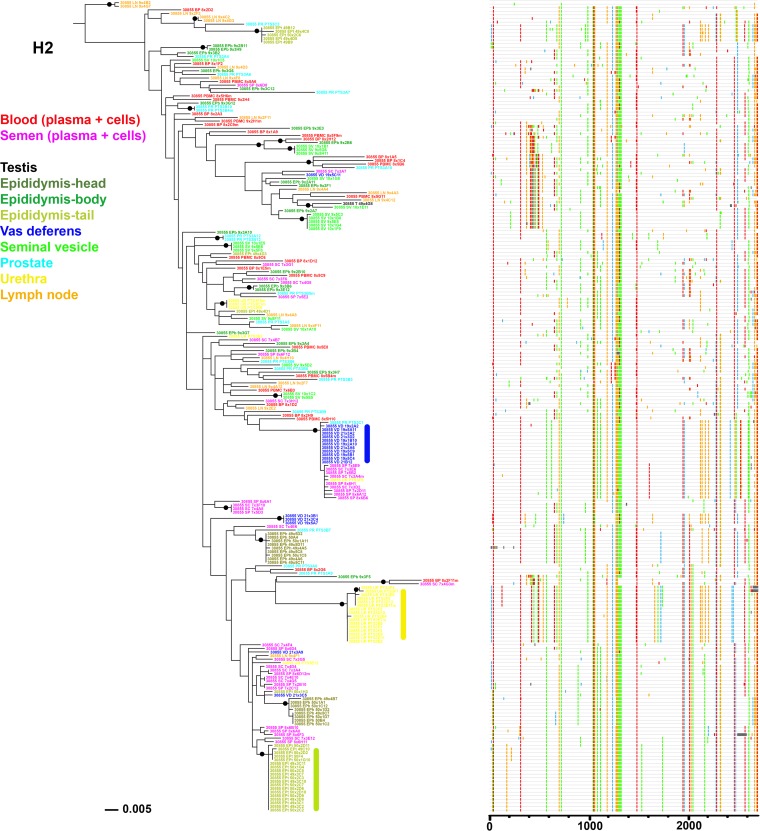
FIG 5.
Analysis of SIV env sequences derived from blood, semen, and male genital organs from macaques H2. Shown is a maximum likelihood phylogenetic tree (left) and Highlighter plot (right) of SGA sequences derived from RNA samples. A clonal amplification-like profile is indicated by a solid bar. Filled circles indicate branches with bootstrap values of ≥70%. The tree was rooted using the viral inoculum sequences (not shown for visual clarity).

