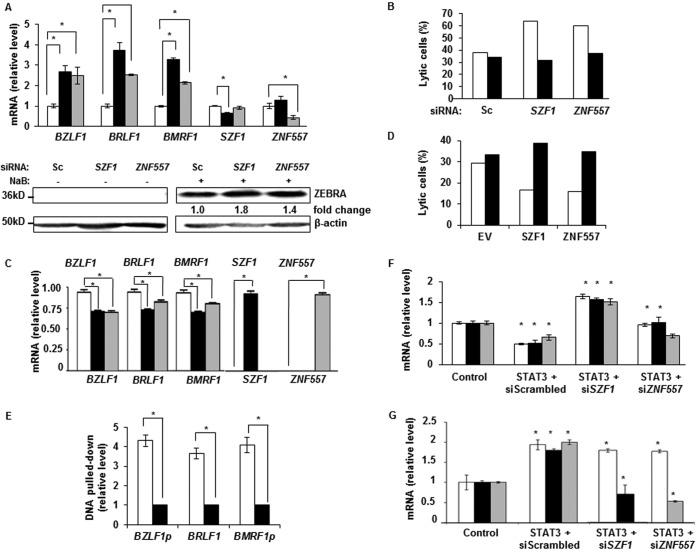
FIG 2.
STAT3 functions via KRAB-ZFPs to regulate repression of lytic genes on the EBV episome. (A and B) EBV+ latent BL cells transfected with scrambled siRNA (open bars), siSZF1 (black bars), or siZNF557 (gray bars) were treated with NaB, and indicated EBV lytic transcripts were quantitated by qRT-PCR and immunoblot analysis with antibodies against β-actin and EBV lytic protein ZEBRA (A). BL cells transfected with indicated siRNAs and FITC-scrambled (Sc) siRNA (to mark transfected cells) were treated with NaB and percentages of lytic cells in FITC+ (i.e., transfected) cells (open bars) and FITC− (i.e., nontransfected) cells (black bars) were determined by flow cytometry (B). Flow cytometry was performed by using human sera to demarcate lytically active cells, as described previously (11), as well as antibodies against SZF1 or ZNF557. (C) BL cells transfected with empty vector (open bars), HA-SZF1 (black bars), or HA-ZNF557 (gray bars) were treated with NaB, and lytic transcripts were measured by qRT-PCR. (D) BL cells were transfected with indicated plasmids and FITC-scrambled siRNA, as described above for panel B, and treated with NaB, and percentages of lytic cells in FITC+ (i.e., transfected) cells (open bars) and FITC− (i.e., nontransfected) cells (black bars) were determined by flow cytometry, as described above for panel B. EV, empty vector. (E) Relative amounts of DNA precipitated by anti-SZF1 antibody in latent BL cells (open bars) versus NaB-treated BL cells (black bars) were determined by qPCR with normalization to input DNA. PCR primers flanked predicted binding sites for SZF1 on indicated EBV genes. p, promoter. (F) BL cells were transfected with control or STAT3 plasmid and indicated siRNAs, exposed to NaB, and examined by qRT-PCR for relative amounts of EBV lytic transcripts: BZLF1 (open bars), BRLF1 (black bars), and BMRF1 (gray bars). (G) BL cells were transfected with control or STAT3 plasmid and indicated siRNAs and examined by qRT-PCR for relative amounts of STAT3 (open bars), SZF1 (black bars), and ZNF557 (gray bars). Data in panels A, C, E, F, and G represent the averages of results from three independent experiments; error bars indicate standard errors of the means (*, p ≤ 0.05). Data in panels B and D are representative of results from 2 independent experiments.

