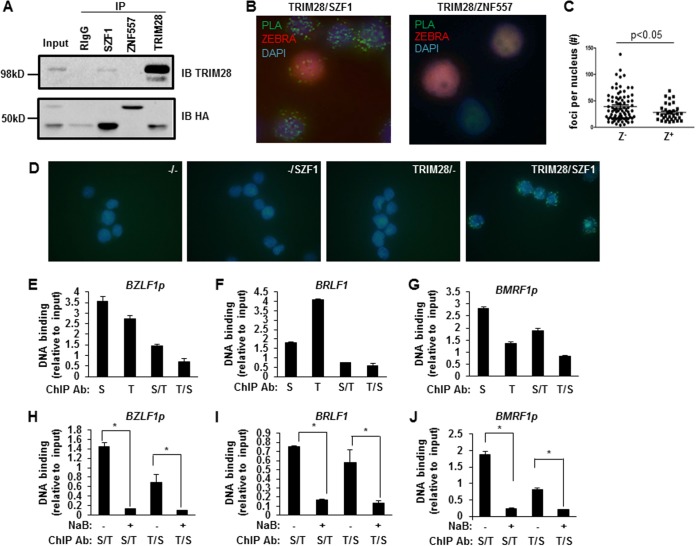
FIG 6.
SZF1 and TRIM28 interact directly and colocalize on EBV lytic promoters preferentially in quiescent/latent cells. (A) Coimmunoprecipitation assays using control rabbit IgG or anti-SZF1, anti-ZNF557, or anti-TRIM28 antibody were performed on BL cells that were cotransfected with HA-SZF1 and HA-ZNF557 plasmids. Precipitates were analyzed by probing with anti-TRIM28 or anti-HA antibody to detect pulled-down endogenous TRIM28 or overexpressed, HA-tagged SZF1 or ZNF557, respectively. IP, immunoprecipitation; IB, immunoblotting. (B) Proximity ligation assays using antibodies targeting SZF1 and TRIM28 (left) or ZNF557 and TRIM28 (right) were performed on NaB-treated BL cells. Lytic cells were identified by immunofluorescence staining with anti-ZEBRA antibody. Representative fields from 3 independent experiments are shown. (C) Thirty lytic (ZEBRA+) and 70 refractory (ZEBRA−) nuclei were examined, and the numbers of PLA foci per ZEBRA+ and ZEBRA− nucleus were determined. (D) PLAs using control goat IgG plus control rabbit IgG (−/−), control goat IgG plus rabbit anti-SZF1 antibody (−/SZF1), goat anti-TRIM28 antibody plus control rabbit IgG (TRIM28/−), or goat anti-TRIM28 plus rabbit anti-SZF1 antibodies (TRIM28/SZF1) were performed on BL cells. Fluorescent green foci indicate in situ interactions between TRIM28 and SZF1. Data are representative of results from 3 independent experiments. (E to G) Chromatin precipitated from BL cells using anti-SZF1, anti-TRIM28, or a control rabbit IgG antibody was subjected to qPCR analysis (S, SZF1; T, TRIM28) using primers spanning bioinformatically predicted SZF1-binding sites within BZLF1p (E), BRLF1 (F), and BMRF1p (G) and normalized to input or subjected to a second round of ChIP using anti-TRIM28 or anti-SZF1 antibody (S/T and T/S), respectively, before qPCR analysis. Negligible amounts of DNA were pulled down by using rabbit IgG control antibody, and values were subtracted from experimental results prior to normalization. (H to J) ChIP–re-ChIP was performed, as described above for panels E to G, on untreated and NaB-treated BL cells. Data represent the averages of results from three independent experiments; error bars indicate the standard errors of the means (*, p ≤ 0.05).

